
Figure 10.
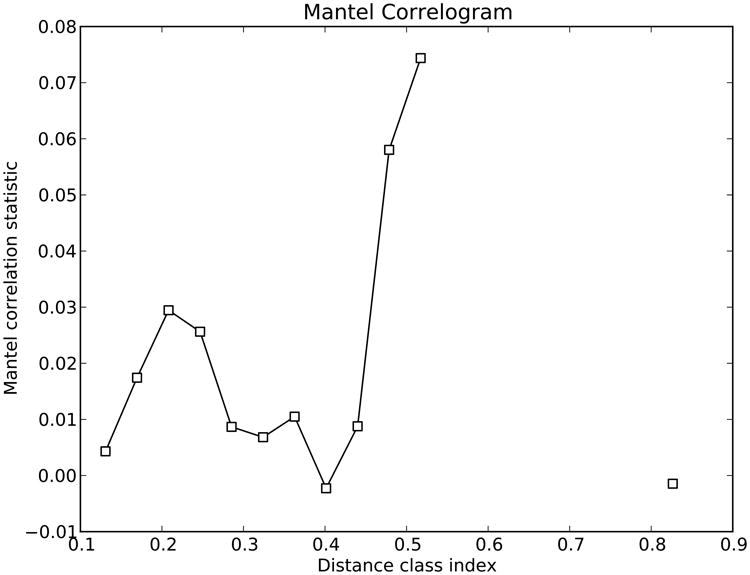
Mantel Correlogram showing the Mantel correlation statistics between unweighted Unifrac distance matrix and each class in the days after experiment started distance matrix. Classes in the second distance matrix are determined by Sturge's rule. White dots show non-significant relationship since black dots show significant ones.