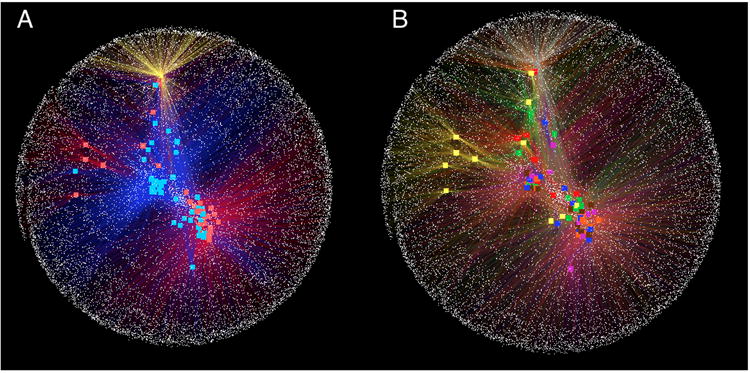
Figure 13.

OTU-Network bacterial community analysis applied in wild type and transgenic mice. (A) Network colored by genotype (wild type: blue; transgenic: red). Control sample (yellow dot) is external in the network and several OTU are not shared with mice. Although we can see some degree of clustering, discrimination by genotypes is difficult to assess. (B) Network colored by body site (mouth: yellow; skin: in red; ileum: in blue; colon: in pink; cecum: in orange; feces: in brown; and multi-tissue samples: in green). A control sample is colored in grey. There is no clear sample clustering by body site, suggesting that there is not a core set of OTUs that differentiates one site from another.
