
Figure 15.
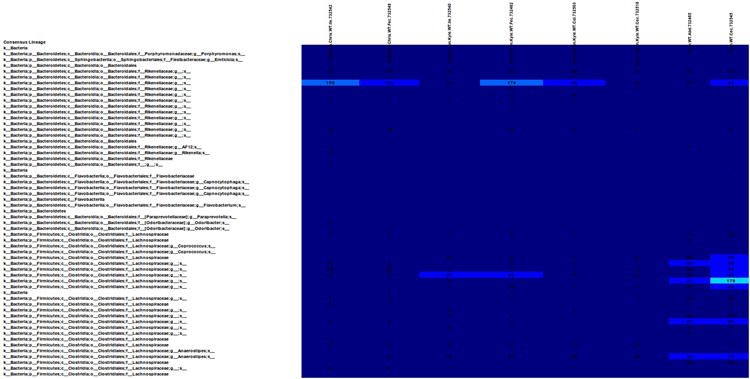
Interactive heatmap of OTUs present in the different samples from transgenic and wild type mice. This visualization is a result of an HTML file that can be opened in any web browser. The advantage of this heatmap is that it is easy to manipulate the abundance level for coloring, or transpose samples and OTUs between columns and rows.