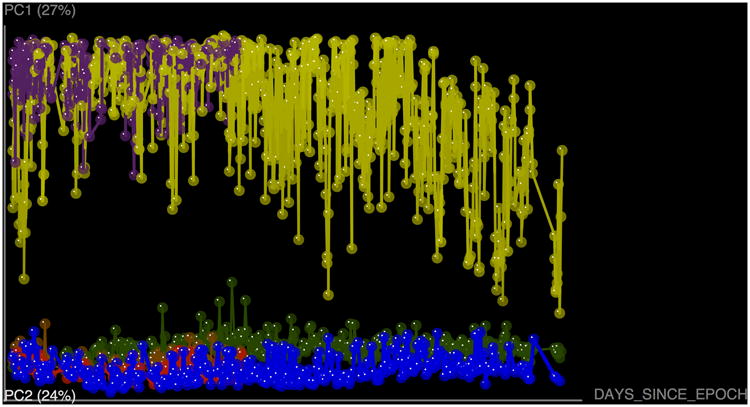
Figure 21.

Three dimensional plots in which two of the axes are PC1 and PC2 and the other is the day when that sample was collected in reference to the epoch time. Although this is not explicitly a beta diversity plot, this representation allows differentiation of the individual trajectories over time.
