
Figure 22.
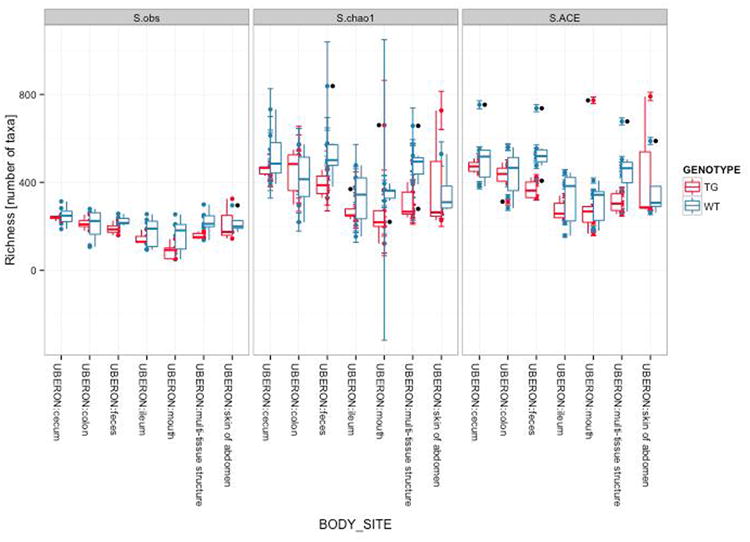
Categorically summarized OTU richness estimates using the plot_richness function. Samples are grouped on the horizontal axis according to body site, and color shading indicates the mouse genotype. The vertical axis indicates the richness estimates in number of distinct OTUs, and a separate boxplot is overlaid on the points for each combination of genotype and body site. The “S.obs”, “S.chao1”, and “S.ACE” panels show the “rarefied” observed richness, Chao-1 richness, and ACE richness estimates, respectively.