
Figure 24.
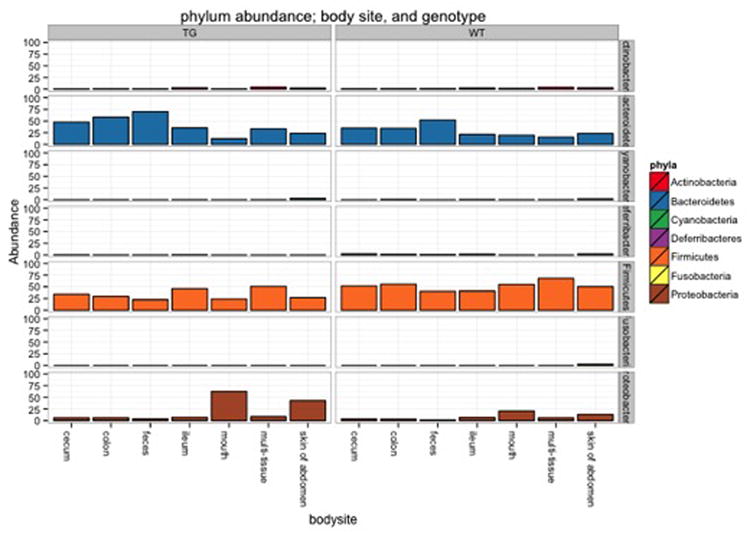
Alteration of the stacked bar plot shown in Figure 23 with an additional facet dimension. In this case, an additional argument has been added to the faceting formula so that the data is separated by a row of panels for each phyla, as well as a column of panels for each mouse genotype. The color shading and other attributes generally remain the same, with the average cross-category changes for each phylum more discernible.