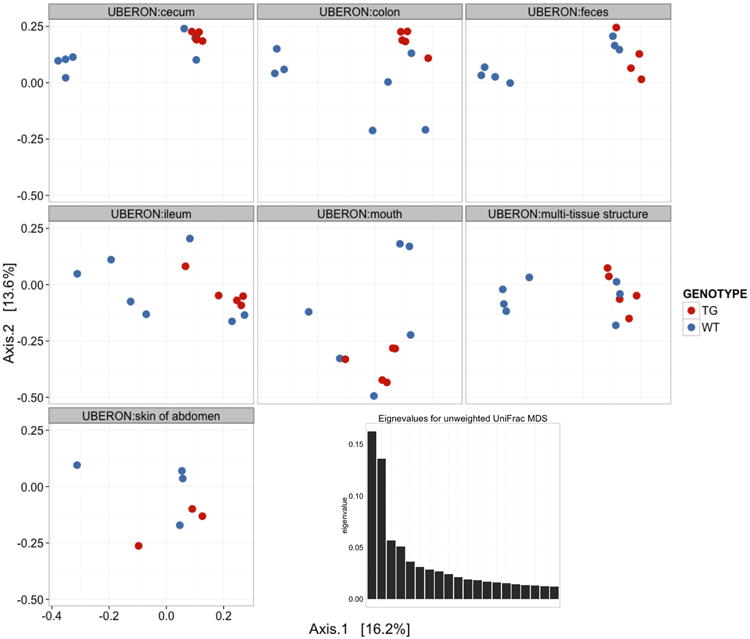
Figure 25.

MDS ordination results on the unweighted UniFrac distances of the open reference dataset. The samples are separated into different panels according to body site, and shaded red or blue if they were from transgenic or wild type mice, respectively. The horizontal and vertical axis of each panel represents the first and second axis of the ordination, respectively, with the relative fraction of variability indicated in brackets. (Inset) A scree plot showing the distribution of eigenvalues associated with each ordination axis.
