
Figure 7.
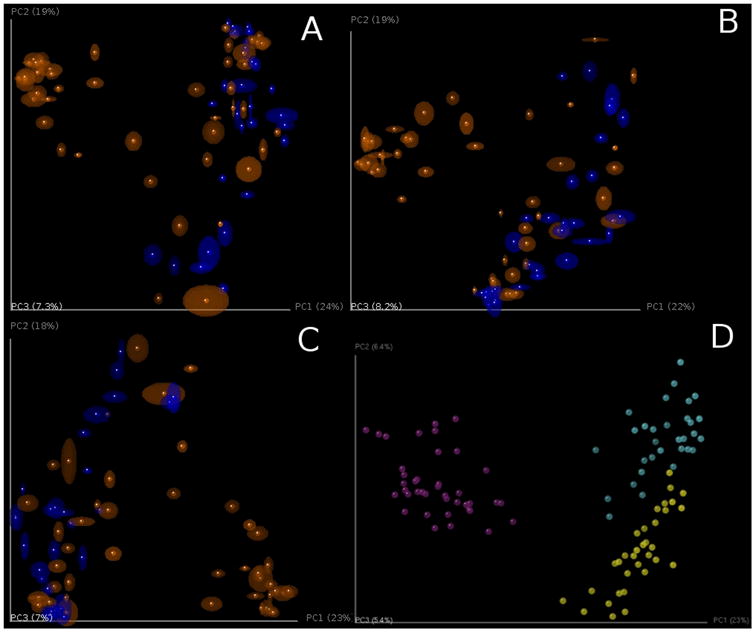
PCoA plots of unweighted Unifrac beta diversity. Panels A-C shows jackknifed replicate results for the example data set using de novo OTU picking, closed-reference OTU picking and open-reference OTU picking, illustrating different results from the three OTU picking approaches (Table 3). Each dot represents a sample, either from a WT mouse (orange) or TG mouse (blue). The two groups are not clearly separated, probably because the data set is contaminated (recall that this is a class project and different participants varied in their dissection skills). The size of the ellipsoids show the variation for each sample calculated from jackknife analysis. These plots are generated by the command jackknifed_beta_diversity.py -i $PWD/denovo_otus/otu_table_filtered.biom -t $PWD/denovo_otus/rep_set.tre -m $PWD/IQ_Bio_16sV4_L001_map.txt -o $PWD/diversity_analysis/jk_denovo -e 7205 -a -O 64 (the input parameters should be adapted for using the OTU tables from different OTU picking approaches). Panel D shows the beta diversity PCoA plot of a data set from the “keyboard” data set (Fierer, Lauber, Zhou, McDonald, Costello, & Knight, 2010) which links individuals to their computer keyboard through microbial community similarity. Each dot represents a microbial community sampled from either fingertips or keyboard keys from three individuals, annotated by the three colors shown in the plot. In contrast to panels A-C, Panel D shows the microbial communities well-separated by individual in the PCoA plot.