
Figure 9.
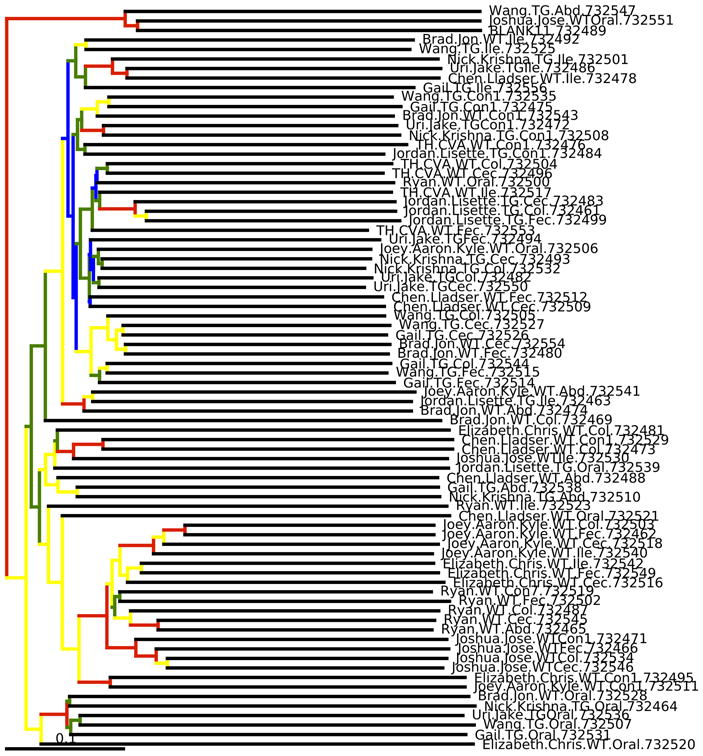
Bootstrapped UPGMA clustering on the example data set. The tree is shown with the internal nodes colored by bootstrap support (red: 75-100%, yellow: 50-75%, green: 25-50% and blue: < 25%). Although this visualization is popular in the literature, we generally recommend alternatives such as PCoA.