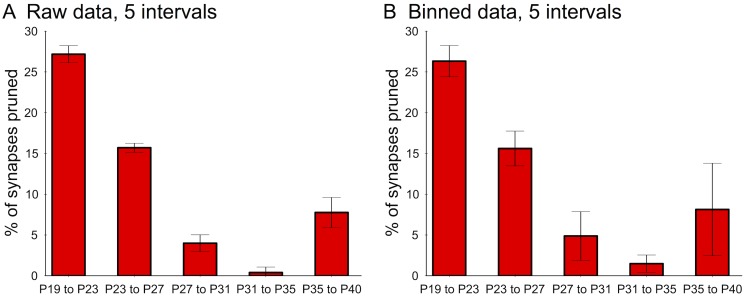
Fig 2. Finer analysis of decreasing synaptic pruning rates.
The pruning period was divided into 5 intervals and the percentage of synapses pruned across successive intervals is depicted by the red bars. Statistics were computed using a leave-out-one strategy on either individual samples from the raw data (A) or on entire time-points using the binned data (B), where samples from a 2-day window were merged into the same time-point. Error bars indicate standard deviation over the cross-validation folds. All successive points are significantly different (P < 0.01, two-sample t-test).

