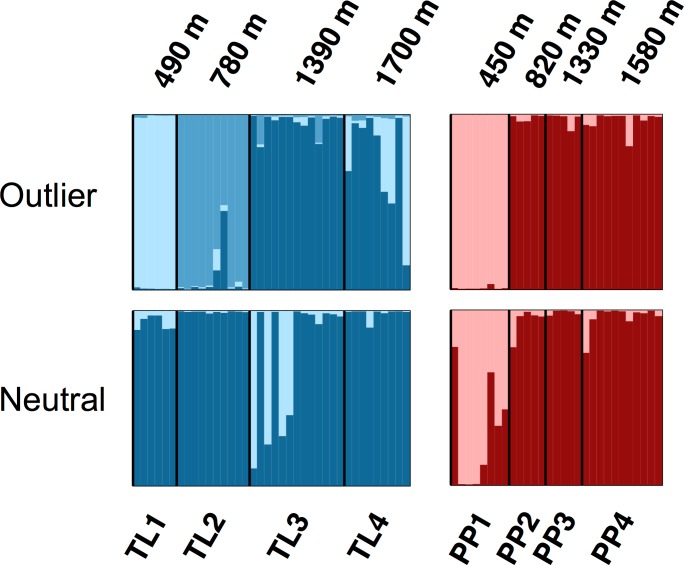
Figure 3. Structure bar plots depicting the model-based clustering results for Thornton Lake (TL) and Pyramid Peak (PP) sites based on outlier loci (above) and neutral loci (below).
Analyses for the TL transect revealed evidence for both K = 2 (ΔK = 473.3) and K = 3 (ΔK = 314.6; plot shown) based on 37 outlier loci, and K = 1 (K = 2 plot shown for display purposes) based on 3,748 neutral loci. Analyses for the PP transect revealed evidence for K = 2 (=123.1) based on 18 outlier loci, and K = 2 (ΔK = 33.1) based on 3,748 neutral loci.

