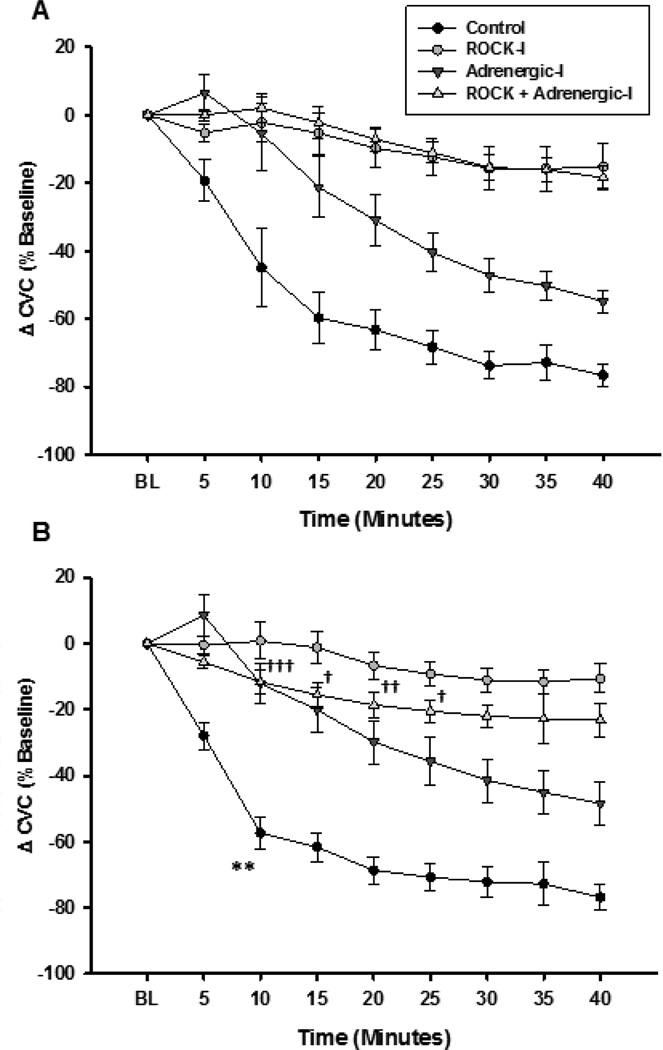
Figure 4.
Cutaneous vascular conductance (ΔCVC %baseline 3)- in (A) normotensive controls and (B) essential hypertensive subjects at baseline (BL; during drug perfusion), and during a local cooling protocol to 24°C at the control site, ROCK inhibited, adrenoceptor inhibited, and ROCK + adrenoceptor inhibited. Values significantly different from normotensive group: Control site ** p<0.001; ROCK + Adrenergic Inhibited site † p<0.05, †† p<0.01, ††† p<0.001.

