
Fig. 3.
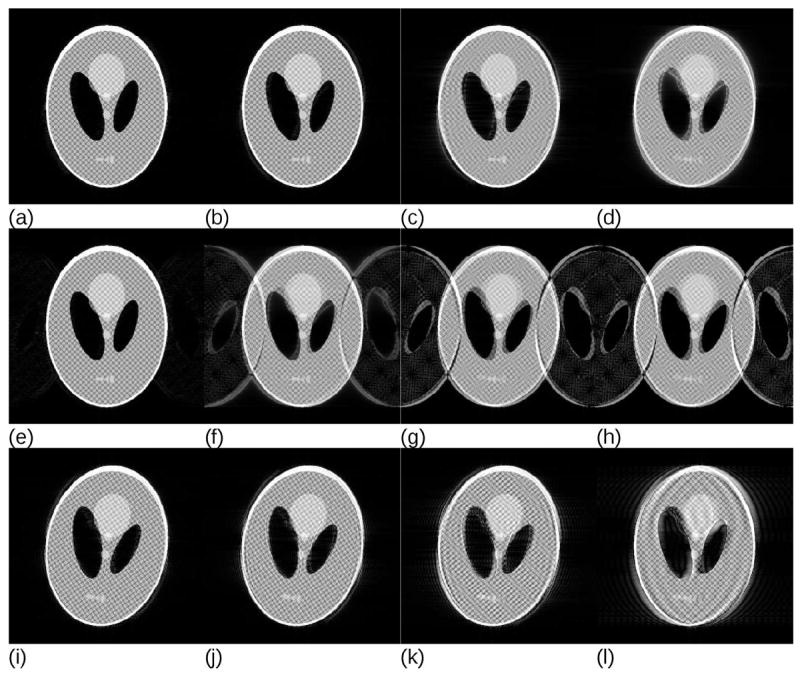
Simulations of a single sudden orientation change during the k-space acquisition for different k-space acquisition strategies and different amounts of inconsistent k-space data. For a linear k-space ordering, images reconstructed from datasets containing (a) 12.5%, (b) 25%, (c) 37.5% and (d) 50% inconsistent data have been simulated. Hardly any artefacts are visible if the corruption occurs outside of the ½ of the maximum k-space distance to the centre. Similar conclusions follow for the two-shot interleaved k-space acquisitions with (e) 12.5%, (f) 25%, (g) 37.5% and (h) 50% of inconsistent data. Images (i-l) present a similar simulation for the centric reordering with (i) 50% of inconsistent with respect to the k-space centre data, (j) 62.5%, (k) 75% and (l) 87.5%, respectively. The precise threshold at which visually detectable artefacts start to appear strongly depends on the image, primarily on the presence of small high-contrast features, but the overall tendency is that below a certain distance from the k-space centre a single motion event produces only negligible artefacts.