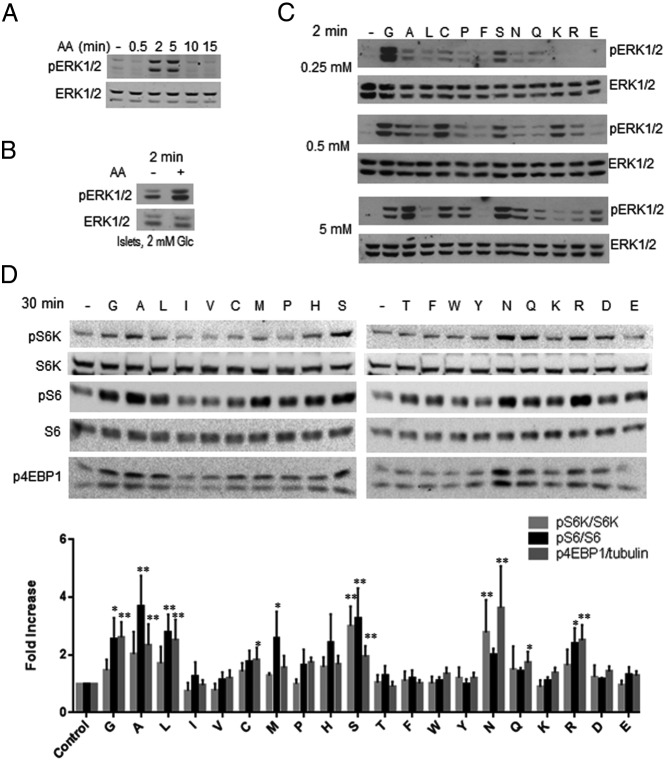
Figure 1.
AAs activate ERK1/2 and mTORC1. MIN6 cells (A, C, and D) were placed in KRBH without AAs (see Materials and Methods) and 4.5 mM glucose for 2–3 hours prior to stimulation with AAs for the times indicated on each panel. Human islets (B) were treated similarly except that 2 mM glucose was used. After treatment, cell lysates were resolved on gels and transferred to nitrocellulose for immunoblotting of pERK1/2, pS6K, pS6 (240/244), or p4EBP1 as indicated. ERK1/2, S6K, and S6 were loading controls used to normalize the p protein signals to total protein amount (eg, pS6K/S6K). The value for the untreated control signal is set to 1. A, Stimulation with AAs for the indicated times and is representative of 10 experiments. Quantification of 4 is shown in Supplemental Figure 1A. B, Stimulation of islets with AAs for 2 minutes. One of two experiments with islets from different donors is shown. C, Stimulation with individual AAs at 0.25, 0.5, or 5 mM for 2 minutes. One of six experiments is shown. D, Stimulation with individual AAs at 1 mM for 30 minutes. Immunoblots show one of three experiments is shown. Bar graphs are means of quantification ± SEM (n = 3). *, P < .05; **, P < .01, using one-way ANOVA.

