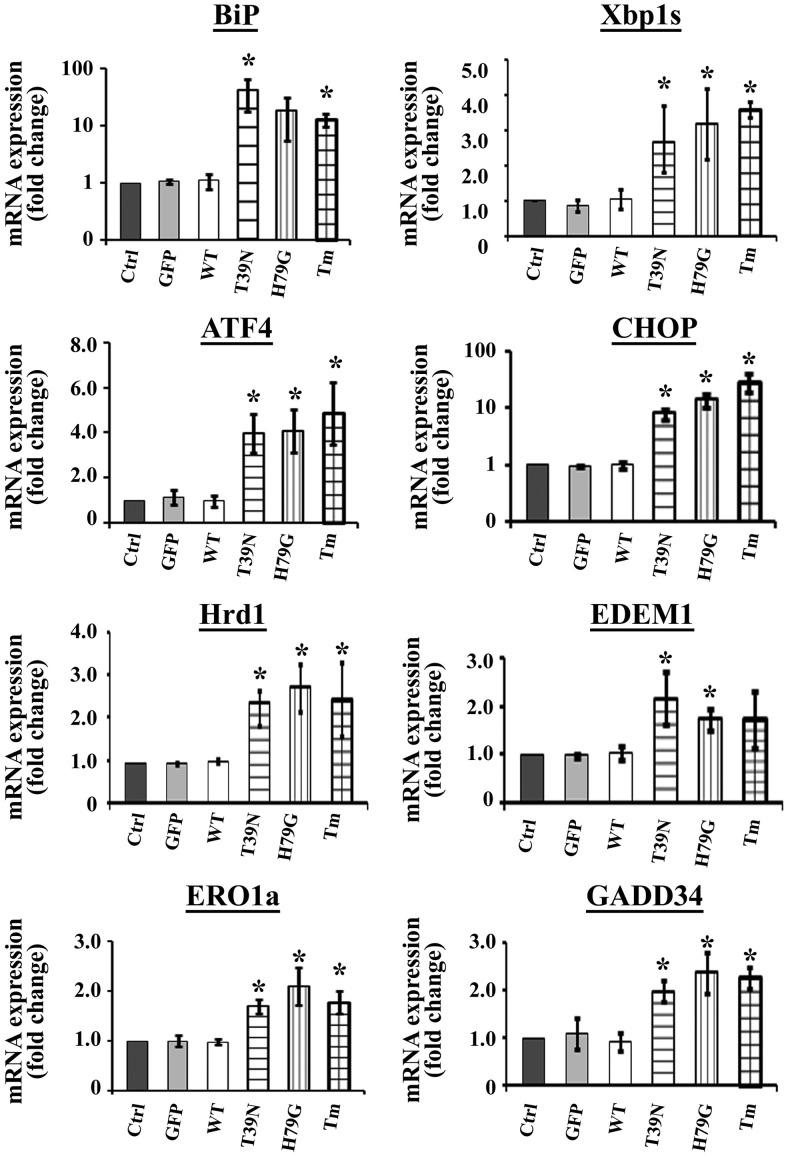
Figure 6.
Sar1 mutants induced ER stress; real-time PCR analyses. MIN6 cells were infected with no virus (control), GFP virus (GFP), wild-type Sar1A (WT), Sar1AT39N (T39N), or Sar1AH79G (H79G) adenovirus for 48 hours. As a positive control of ER stress inducer, MIN6 cells were also treated with Tm at 5 μg/mL for 6 hours. RNA was extracted from treated MIN6 cells, and quantitative real-time PCR was performed as described in Materials and Methods. Results were expressed as fold changes of corresponding mRNA levels relative to that of the control cells (mean ± SE from 4 separate biological experiments). Student's t test was used for the statistical analysis; *, P < .05.

