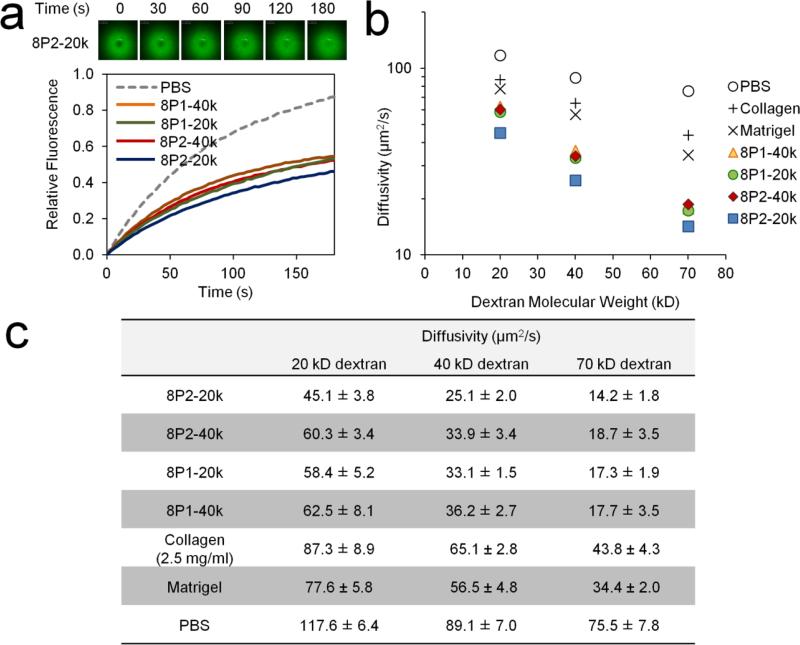
Fig. 4.
FRAP characterization of dextran diffusivity within MITCH-PEG variants. (a) Representative time-lapse fluorescence images of a photobleached area (upper left panel) and the corresponding fluorescence recovery curves obtained from 40 kD dextran (bottom). (b) Diffusivity constants derived from fluorescence recovery curves are plotted on a semi-logarithmic graph and reported in the table (c). Values obtained from encapsulation in common biomatrices (collagen and Matrigel) and PBS are included for comparison.

