Fig. 6.
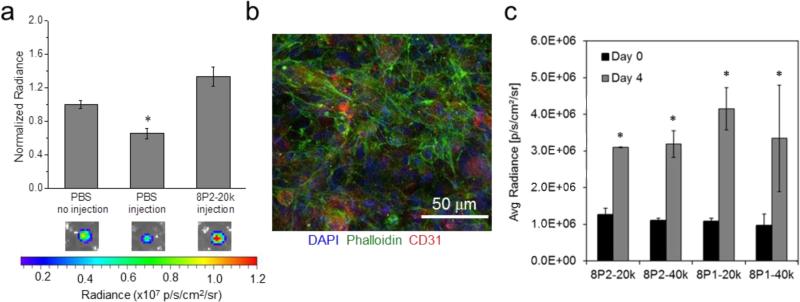
(a) Bioluminescence imaging (BLI) quantification of acute hiPSC-ES viability following in vitro injection. Pre-encapsulation of hiPSC-ECs (Fluc+) in MITCH improved post-injection viability relative to injected cells suspended in PBS,* p < 0.05. (b) Three-dimensional (3D) culture of hiPSC-ECs in 8P2-20k variant of MITCH-PEG. Visualization of cell morphology at day 4 of encapsulation by confocal immunofluorescence. Cell nuclei shown by DAPI staining in blue, F-actin cytoskeleton by phalloidin staining in green, and CD31 endothelial cell marker in red. (c) BLI quantification of hiPSC-ECs within four different variants of MITCH-PEG at days 0 and 4 post-injection, * p < 0.05.

