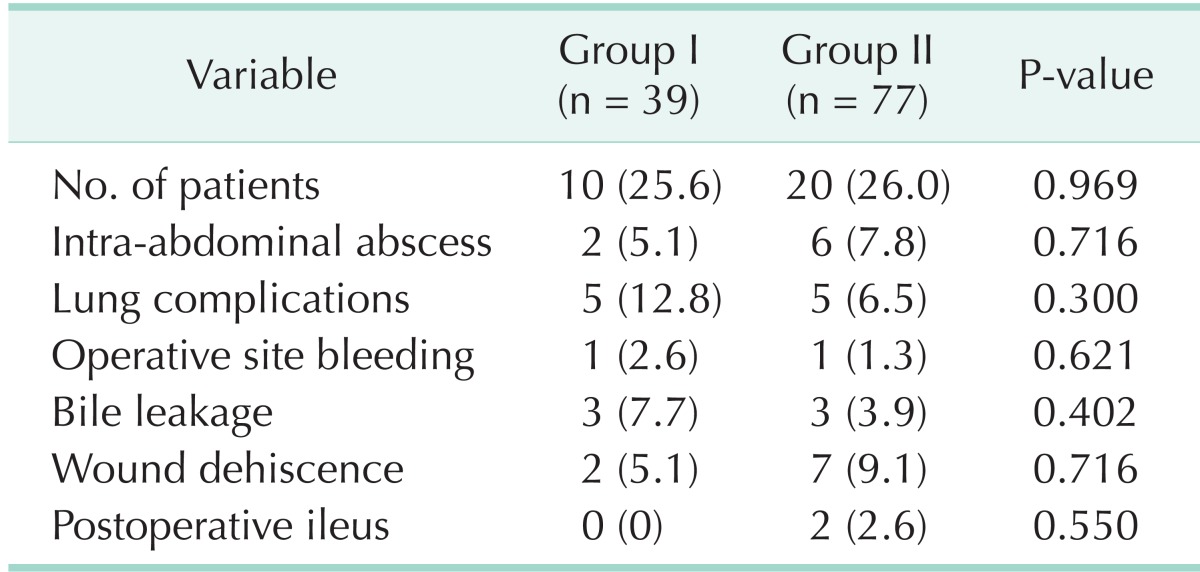
Table 3. Comparison of postoperative complications.

Values are presented as number (%).
Group I, PTGBD group; Group II, Non-PTGBD group; PTGBD, percutaneous transhepatic gallbladder drainage.

Values are presented as number (%).
Group I, PTGBD group; Group II, Non-PTGBD group; PTGBD, percutaneous transhepatic gallbladder drainage.