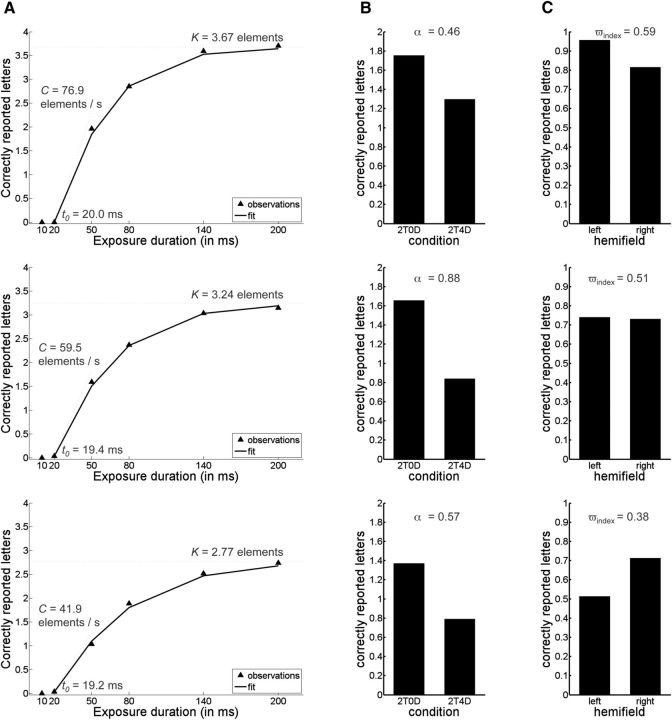
Figure 2.
The raw data plots from three representative participants illustrating the relationship between the raw data and the five calculated parameters. A, Whole report data when 6 targets are presented at the different exposure duration. In addition to the plotted raw scores/observations (black triangles), the scores predicted by the TVA model are plotted (solid black line) to indicate that the model is a good fit to the data and to illustrate how K, C, and t0 parameters are related to these scores. B, The data when 2 targets are presented with and without distractors (2T4D = 2 targets and 4 distractors; 2T0D = 2 targets and 0 distractors). The difference between both conditions relates to α parameter. C, Average number of correctly reported letters in the left and right visual field (averaged across all conditions in the experiment). The difference between both conditions measures the laterality index (ωindex). To further assess the relationship between raw data and the calculated TVA parameters, we performed correlation analyses, which showed overall good correspondence between the raw and calculated measures. For example: (1) the raw scores for the whole report: 6 target letter condition (measuring the number of reported letters at the longest exposure duration, i.e., 200 ms) were strongly correlated with TVA-based K parameter (r = 0.91); (2) the difference in the raw scores between the number of correctly reported letters at 10 and 80 ms was strongly correlated with TVA-based parameter C (r = 0.85); (3) based on the raw scores for conditions 2T0D and 2T4D (2T4D = 2 targets and 4 distractors; 2T0D = 2 targets and 0 distractors), we calculated an attentional selection index 2T0D/(2T0D + 2T4D), which was strongly correlated with TVA-based α parameter (r = 0.88); and (4) based on the raw scores for the left and right visual fields, we calculated the following LI left/(left + right), which was strongly correlated with the TVA-based laterality index (ωindex; r = 0.99).

