
Figure 12.
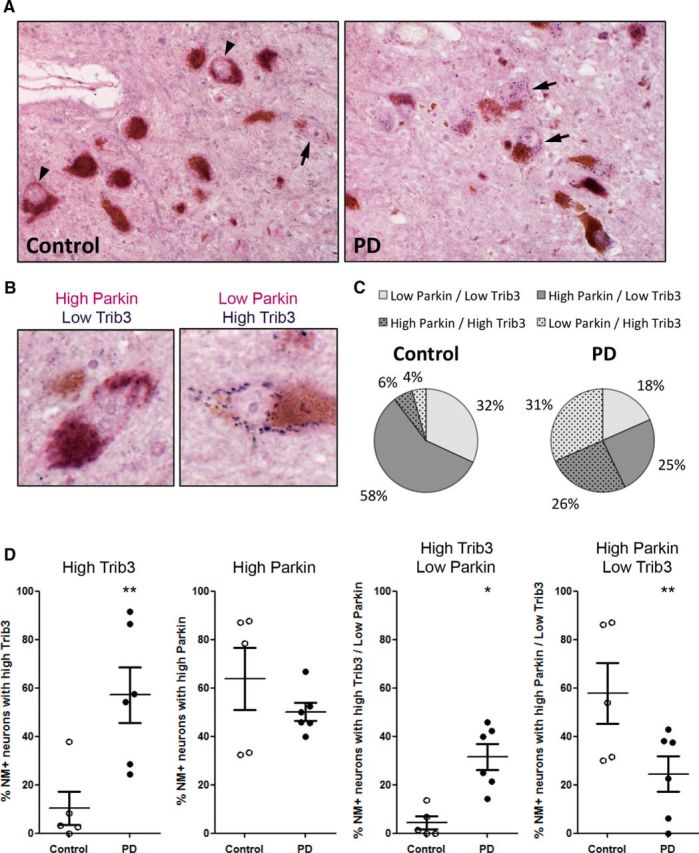
Trib3 and Parkin coexpression in the substantia nigra of control and PD patients. A, Representative images of dopaminergic neurons in postmortem midbrains from age-matched human control and PD patients immunostained for Trib3 (blue) and Parkin (violet). Dopaminergic neurons are identified by the presence of neuromelanin (NM) inclusions (brown). Arrows indicate NM+ neurons highly positive for Trib3 staining. Arrowheads indicate NM+ neurons highly positive for Parkin immunostaining. B, High-magnification images of two examples of dopaminergic neurons displaying high Parkin and low Trib3 levels (left) and low Parkin and high Trib3 levels (right). C, Pie charts showing the proportion of NM+ neurons with low Parkin/low Trib3, high Parkin/low Trib3, low Parkin/high Trib3, and high Parkin/high Trib3 staining observed in controls (left) and PD cases (right). D, Scatter plots showing, from left to right: the proportion of NM+ neurons with high Trib3, high Parkin, high Trib3/low Parkin, high Parkin/low Trib3 staining in controls and PD patients. *p < 0.05 (t tests). **p < 0.005 (t tests). These data are based on the blinded scoring of 5 control and 6 PD patients' brains. A total of 225 NM+ neurons were scored in controls, and 233 NM+ neurons were scored in PD cases.