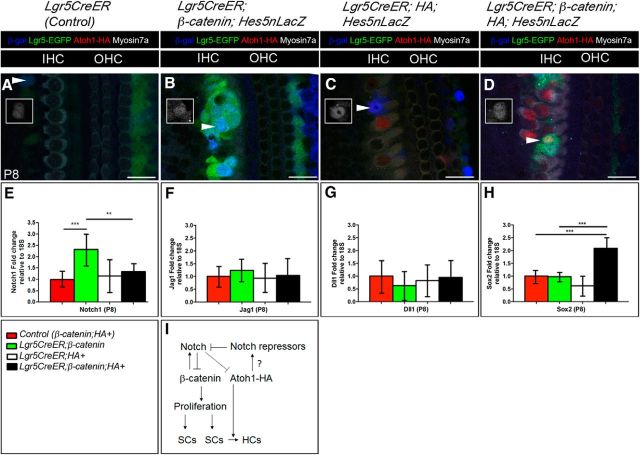
Figure 5.
β-Catenin upregulates Notch, but its expression is abrogated by β-catenin and Atoh1-HA in Lgr5+ cells. A–D, Confocal images of immunostained cochleae from Lgr5CreER (Control) (A), Lgr5CreER;β-catenin;Hes5nLacZ (B), Lgr5CreER;HA+;Hes5nLacZ (C), and Lgr5CreER;β-catenin;HA+;Hes5nLacZ (D) mice that were induced with tamoxifen at P0-P1 and analyzed at P8. Hes5 upregulation in Lgr5+ foci from Lgr5CreER;β-catenin;Hes5nLacZ mouse (arrowhead and inset) suggests active Notch signaling mediated by β-catenin. Very few Hes5nLacZ-positive cells were observed in Lgr5CreER;HA+ (C, arrowhead and inset) and Lgr5CreER;β-catenin;HA+;Hes5nLacZ (D, arrowhead and inset). E, qPCR analysis of Notch1 from isolated P8 cochlea shows an increase and decrease in Lgr5CreER;β-catenin mice (CT value = 29.81 ± 0.98; 18S CT value = 20.59 ± 0.61) and Lgr5CreER;β-catenin;HA+ mice (CT value = 30.68 ± 0.96; 18S CT value = 20.68 ± 0.55) relative to control littermates (CT value = 31.13 ± 0.87; 18S CT value = 20.69 ± 0.47), respectively. For Lgr5CreER;HA+ mice: CT value = 30.56 ± 1.15; 18S CT value = 20.34 ± 0.49. F, G, qPCR analysis of Jagged1 (Jag1) and Delta-like 1 (Dll1) ligands from isolated P8 cochlea shows no change in expression between all genotypes. In the case of Jagged1: for control littermates: CT value = 31.11 ± 0.50; 18S CT value = 20.61 ± 0.75, for Lgr5CreER;HA+: CT value = 31.01 ± 0.84; 18S CT value = 20.42 ± 0.60, for Lgr5CreER;β-catenin+: CT value = 30.26 ± 0.79; 18S CT value = 20.08 ± 0.53, and for Lgr5CreER;β-catenin;HA+: CT value = 30.94 ± 1.10; 18S CT value = 20.51 ± 0.70. In the case of Dll1: for control littermates: CT value = 35.58 ± 1.22; 18S CT value = 20.76 ± 0.58, for Lgr5CreER;HA+: CT value = 35.28 ± 0.90; 18S CT value = 20.19 ± 0.35, for Lgr5CreER;β-catenin+: CT value = 35.68 ± 1.14; 18S CT value = 20.19 ± 0.45, and for Lgr5CreER;β-catenin;HA+: CT value = 35.56 ± 1.29; 18S CT value = 20.67 ± 0.63. H, qPCR analysis of Sox2 from isolated P8 cochlea shows a 2.09 ± 0.38 increase in Lgr5CreER;β-catenin;HA+ mice. The statistical significance of this increase was assessed by Student's t test with Bonferroni correction where the p = 3.04 E-09; df = 46; n = 4 (Control vs Lgr5CreER;β-catenin;HA+) and p = 7.52 E-04; df = 46; n = 3 (Lgr5CreER:HA+ vs Lgr5CreER;β-catenin;HA+). In this case, control littermates: CT value = 34.45 ± 0.41; 18S CT value = 21.50 ± 0.38, for Lgr5CreER;HA+: CT value = 35.04 ± 0.61; 18S CT value = 21.41 ± 0.37, for Lgr5CreER;β-catenin+: CT value = 34.37 ± 0.28; 18S CT value = 21.39 ± 0.30, and for Lgr5CreER;β-catenin;HA+: CT value = 33.36 ± 0.69; 18S CT value = 21.47 ± 0.29. I, Proposed model for the synergism of β-catenin and Atoh1 involving Notch upregulation (by β-catenin) and its downregulation by Atoh1 in Lgr5CreER;β-catenin;HA+ mouse. Dashed line of Notch to Atoh1-HA indicates the presumed low repression of Notch on the overexpressed Atoh1-HA. Question mark on the arrow between Atoh1-HA and Notch repressors indicates our current lack of targets. **p < 0.003 (unpaired Student's t test). ***p < 0.0003 (unpaired Student's t test). Refer to text for actual p values. N = 3 or 4 for each time point and each genotype. Data are mean ± SEM. Scale bars, 25 μm.

