
Figure 1.
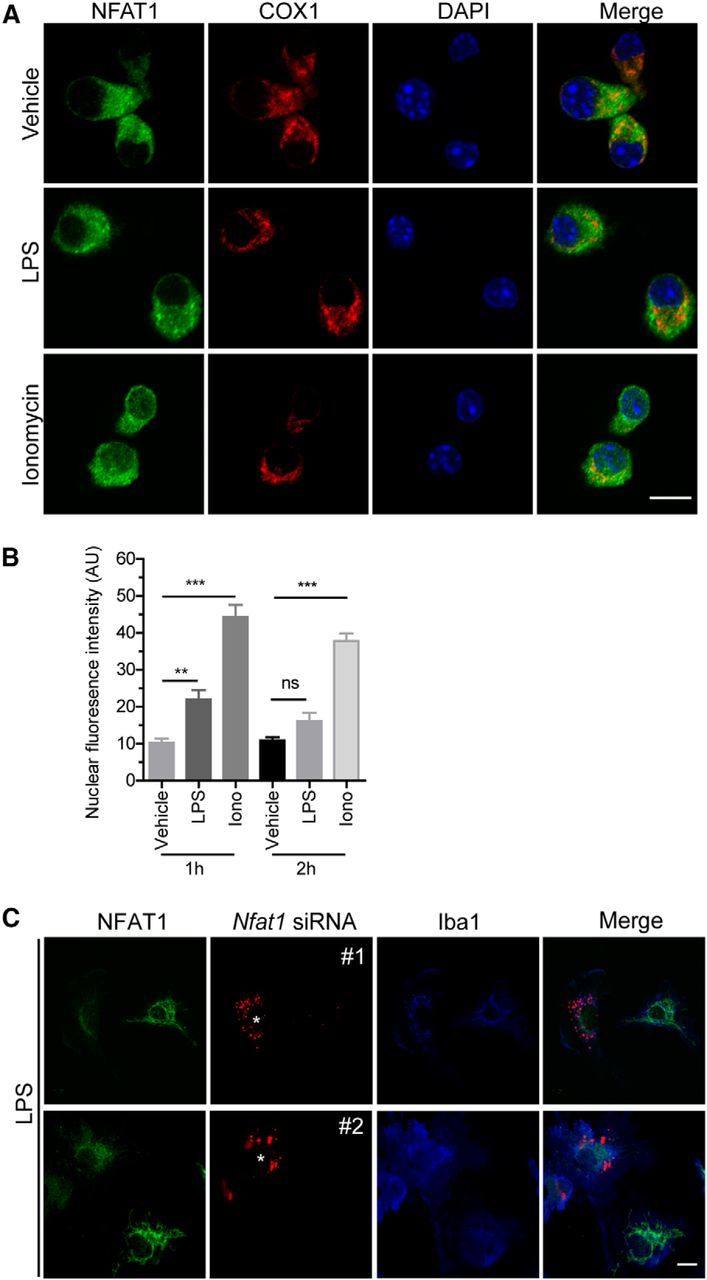
NFAT1 shows less nuclear translocation in response to LPS stimulation in microglia. A, Confocal images show NFAT (green), COX1 (red), and DAPI (blue) signals in primary microglia treated with LPSs (200 ng/ml) or ionomycin (Iono; 1 μm) for 2 h. B, Quantification of microglial confocal images shows that LPSs induced only a modest increase of nuclear NFAT1 after 1 h treatment and failed to induce any obvious nuclear translocation of NFAT1 after treatment for 2 h. As a positive control, ionomycin treatment induced more nuclear NFAT1 translocation in microglia. Data represent the mean ± SD of three independent experiments with n ≥ 150 cells per experiment. **p < 0.01; ***p < 0.001. C, Confocal images show NFAT (green), Nfat1 siRNAs (red; #1 and #2), and Iba1 (blue) signals in Nfat1 siRNA-transfected primary microglia after treatment with LPSs for 24 h. Scale bars: A, 10 μm.