
Figure 2.
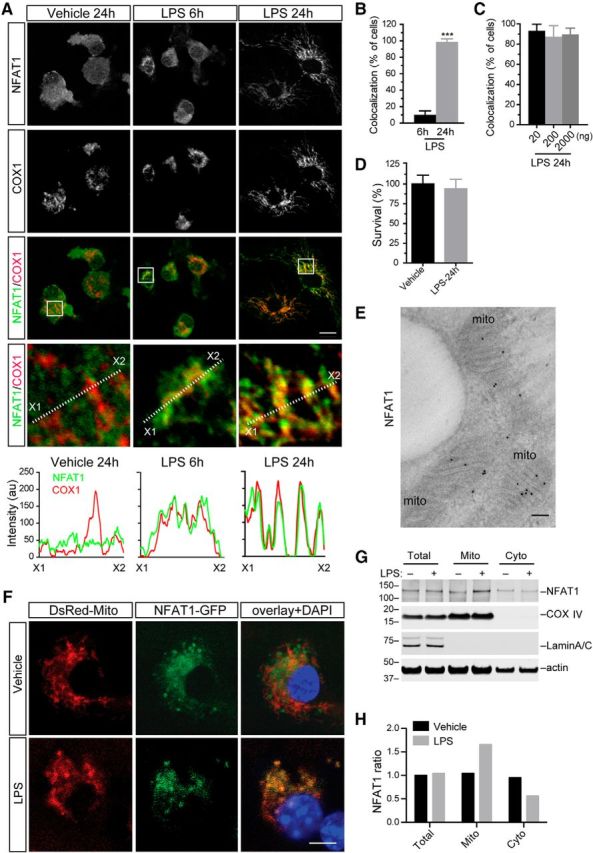
Prolonged LPS stimulation induces mitochondrial translocation of NFAT1 in microglia. A, Representative confocal images show NFAT1 (green) and mitochondrial marker COX1 (red) staining in primary microglia treated with vehicle for 24 h or LPSs (200 ng/ml) for 6 and 24 h. White dashed lines highlight the optic sections for line scans, which illustrate the fluorescence intensities of NFAT1 (green) and COX1 (red) along the selected lines. B, Bar graph depicts the percentage of microglia showing NFAT1 and COX1 colocalization after treatment with LPSs for 6 and 24 h. ***p < 0.001. C, Bar graph shows that there is no significant dose effect on LPS-induced NFAT1 mitochondrial translocation when microglia are treated with 20, 200, and 2000 ng/ml LPSs for 24 h. D, Bar graph shows the surviving rates of microglia treated with vehicle or LPSs for 24 h. Data represent the mean ± SD for three independent experiments with n ≥ 150 cells per experiment. E, Representative image shows immunogold EM staining of NFAT (dark pigments) in primary microglia treated with 200 ng/ml LPSs for 24 h. Mitochondria are indicated as “mito.” F, Representative images show DsRed-Mito and NFAT1-GFP distribution in live primary microglia treated with vehicle or 200 ng/ml LPSs for 24 h. The nucleus was labeled by DAPI. G, Western blots show NFAT1 protein accumulation in total cell lysates as well as in mitochondrial (Mito) and cytosol (Cyto) fractions of microglia after treatment with vehicle or 200 ng/ml LPSs for 6 h. COXIV and LaminA/C were used as mitochondrial and nuclear marker proteins. β-actin was used as loading control. H, Bar graph shows the ratio of NFAT1 in the mitochondrial and cytosolic fractions of microglia treated with vehicle or LPSs. Scale bars: A, F, 10 μm; E, 100 nm.