
Figure 9.
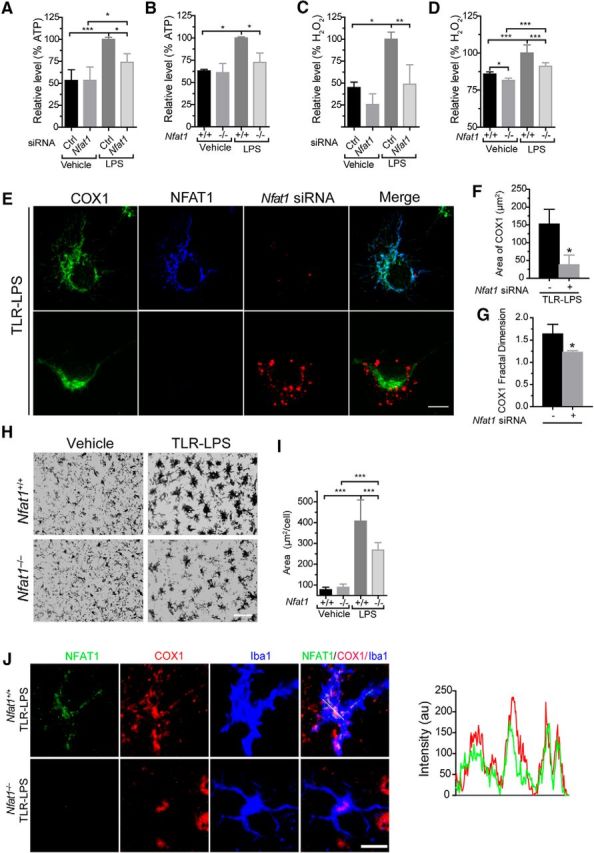
The mitochondrial translocation of NFAT1 promotes cellular ATP and ROS production in vitro and microglial activation in vivo. A–D, Cellular ATP (A, B) and ROS (C, D) production are both increased in microglia after 24 h of LPS stimulation. Transfection of Nfat1 siRNA significantly reduces cellular ATP (A) and ROS (C) levels. Microglia from Nfat1−/− mice also show significantly lower levels of ATP (B) and ROS (D) compared with controls. Data represent the mean ± SD for three independent experiments. E, Confocal images show COX1 (green), Nfat1 siRNA (red), and NFAT (blue) signals in Nfat1 siRNA-transfected primary microglia treated with TLR-LPSs for 24 h. F, G, Bar graphs show the surface area (F) and the complexities of mitochondrial morphology (G) in Nfat1 siRNA-transfected and control microglia. Data represent the mean ± SD for three independent experiments with n ≥ 50 cells per experiment. H, Iba1 immunohistochemistry reveals microglia in the striatum of Nfat1+/+ and Nfat1−/− mice treated with vehicle or TLR-LPSs. I, Bar graph quantifies the area of microglial cell bodies in the striatum of Nfat1+/+ and Nfat1−/− mice treated with vehicle or TLR-LPSs. n = 3 animals per treatment per genotype. J, Confocal images show NFAT1 (green), COX1 (red), and Iba1 (bule) in striatal sections of Nfat1+/+ and Nfat1−/− mice after intraperitoneal injection with TLR-LPSs. Line graph illustrates the fluorescence intensities of NFAT1 (green) and COX1 (red) along the dashed line. Scale bars: E, J, 10 μm; H, 50 μm. *p<0.05; **p < 0.01; ***p < 0.001.