
Figure 2.
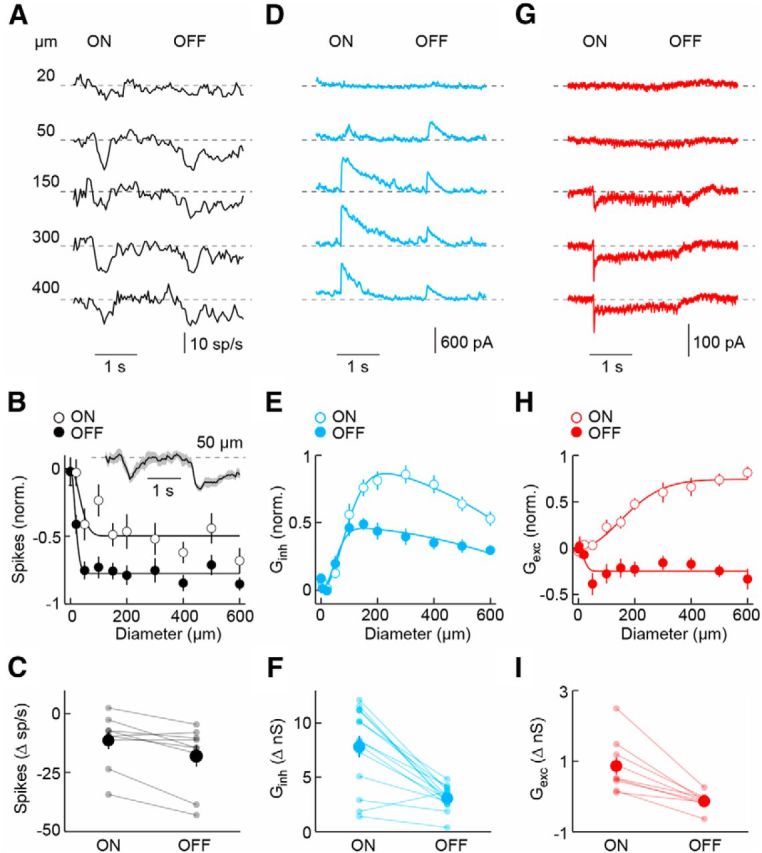
Spatial response and synaptic input profiles of SbC-RGCs. A, D, G, Representative spike (A, 40 ms bins), IPSC (D), and EPSC (G) responses to stimuli in which intensity in a circular area (diameter noted in A) is modulated by a square wave (2 s ON, 2 s OFF). B, E, H, Summary data of ON (open circles) and OFF (filled circles) sensitivity profiles of SbC-RGCs for spike responses (B, n = 9), inhibitory (E, n = 14; Ginh), and excitatory synaptic conductances (H, n = 9; Gexc). The responses of each cell were normalized to the maximal absolute response amplitude of that cell. The average (±SEM) spike response of SbC-RGCs to 50 μm stimuli is shown as a line (shaded area) inset in B. Single-Gaussian (B, H) and difference-of-Gaussian (E) fits are shown as solid lines. C, F, I, Amplitudes of ON and OFF responses to circles with a diameter of 300 μm. Dots show data from individual cells and circles (error bar) indicate mean (±SEM) of respective population. Spike suppression was greater at light OFF than ON (p < 0.01, n = 9), inhibition (Ginh) greater at light ON than OFF (p < 10−4, n = 14), and excitation (Gexc) greater at light ON than OFF (p < 0.01, n = 9).