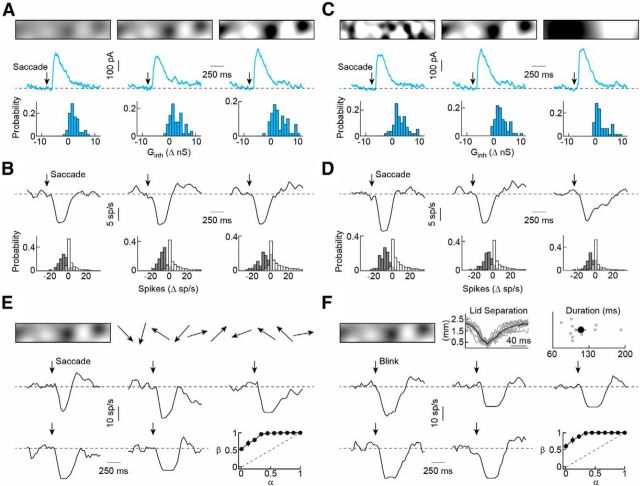
Figure 4.
SbC-RGC responses to stimuli mimicking saccade-like eye movements and blinks. A, B, IPSC responses (A) and spike responses (B, 40 ms bins) to shifts of random textures with different contrasts (25%, 50%, and 100%). A, Top, Illustrations of image patterns. Middle, Representative IPSC responses to shifted images with different contrasts (texture scale, 100 μm). Bottom, Probability distribution of inhibitory (Ginh) responses to saccade-like stimuli (n = 60 saccades recorded in four SbC-RGCs). B, Top, Representative spike responses to the same stimuli as in A. Bottom, Probability distribution of spike responses of SbC-RGCs (gray bars, n = 105 saccades recorded in seven cells) and non-SbC-RGCs (white bars, n = 3615 saccades recorded in 241 cells on MEAs). C, D, Analogous to A (C) and B (D), but for shifts of images with different texture scales (50, 100, and 200 μm), as illustrated at the top. The same numbers of saccades and cells were recorded in C and D as in A and B, respectively. Traces in A and C, and B and D, were recorded in the same cell and two examples are therefore repeated. E, F, Representative spike responses to stimuli mimicking a series of saccade-like eye movements (E) and blinks (F). E, Top, Texture images (contrast, 50%; scale, 100 μm) shifted successively in 10 random directions. Bottom, Representative spike responses (40 ms bins) to image shifts and mean (±SEM) ROC curves (bottom right) illustrating the ability to detect shifts based on SbC-RGC responses (n = 5 cells). The dashed line shows the unity diagonal of hit rate (β) and false-alarm rate (α). F, Top middle, Eyelid separation as a function of time recorded in four WT mice. Thin gray traces show individual blinks, whereas the thick black line indicates the population average. Top right, The distribution of blink durations. Gray dots show data from each blink (n = 11), and the black circle (error bar) indicates the mean (±SEM) of the population. Bottom, Representative spike responses to blackouts and mean (±SEM) ROC curves (bottom right) illustrating the ability to detect blinks based on SbC-RGC responses (n = 5 cells).

