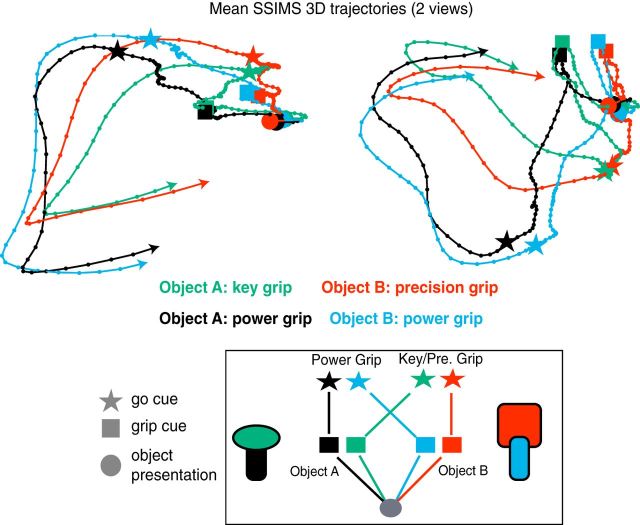
Figure 7.
SSIMS trajectories: linking objects to actions. The temporal evolution of ensemble activity is tracked by generating SSIMS projections from sliding time windows (1 s duration, sliding by 50 ms). The resulting space captures the relationship between activity patterns observed at different task phases. The mean trajectories for the four different types of trials are shown in different colors for one session in Monkey G (two viewpoints are provided to display 3D structure). Dots along the lines mark the 50 ms shifts in the time bins. Trajectories were smoothed with a Gaussian kernel (400 ms SD). Object presentation events, grip cues, and go cues, are highlighted by circles, stars, and squares, respectively. The graph in the boxed region shows a summary of the general pattern observed. Similar results were obtained for the other two monkeys.

