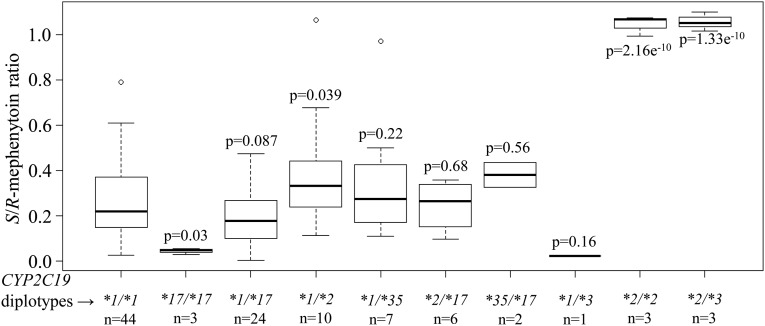
Fig. 8.
CYP2C19 activity in 104 Ethiopians with different CYP2C19 genotypes. S/R-mephenytoin ratio is plotted for each CYP2C19 diplotype group. Box plots indicate the 25th and 75th percentiles, the bold line within the box represents the median, and whiskers represent the range after excluding the outliers. Statistical analyses were performed using R version 3.1 (http://www.rproject.org). A general linear model was used to obtain P values for each group compared with the CYP2C19*1/*1 group. Number of subjects (n).

