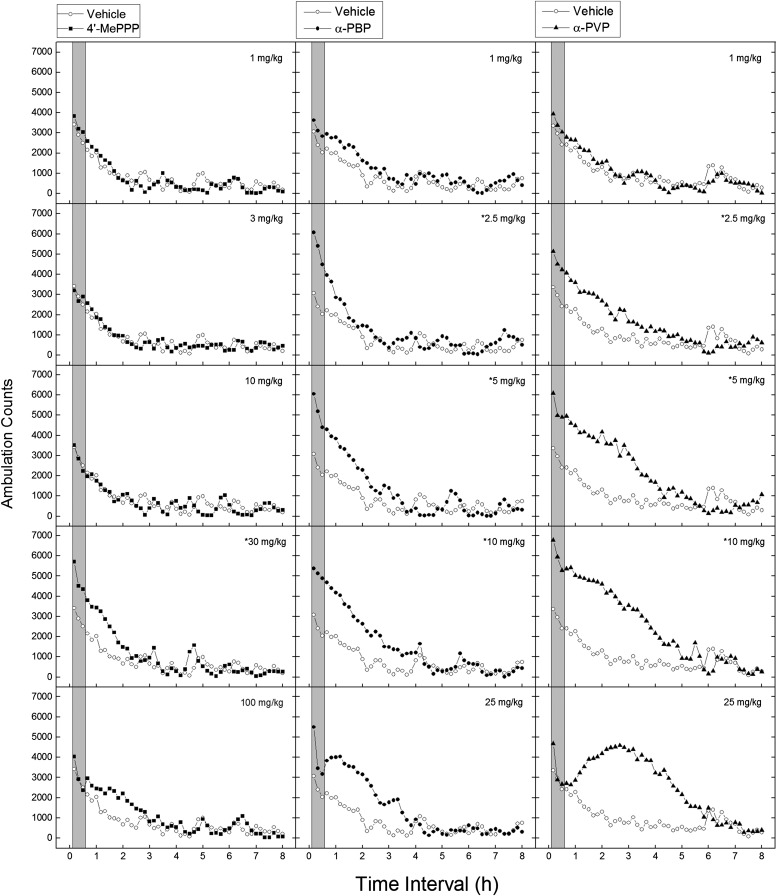
Fig. 1.
Time course of locomotor activity in mice. Data are represented as mean number of ambulation counts for each 10-minute period over 8 hours for each dose (n = 8) of 4ʹ-MePPP (left), α-PBP (middle), and α-PVP (right). The gray bar shows the time range of maximal effect used for analysis of dose effect (0–30 minutes). *Doses statistically significantly different from vehicle for the period of 0–30 minutes after injection (P < 0.05). Vehicle (0.9% saline) data were obtained from one group of mice (n = 8) and are displayed in each panel to indicate dose-dependent differences of drug-induced motor activity from vehicle-treated mice.

