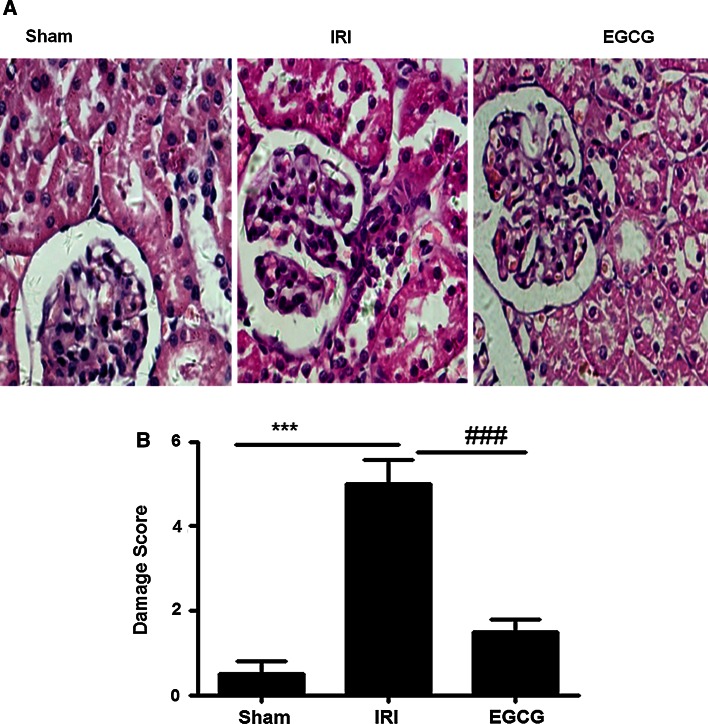
Fig. 3.
Effects of EGCG pretreatment on I/R-induced renal histologic change. Representative microphotographs were taken from the kidneys of the sham, IRI and EGCG groups at the time point of 24 h after renal I/R. Histopathologic examination was performed using HE staining (a). Semiquantitative assessment of the histologic lesions based on tubular necrosis (b). Data were represented as mean ± SEM (n = 10). ***P < 0.001 (IRI vs. sham); ### P < 0.001 (IRI vs. EGCG)

