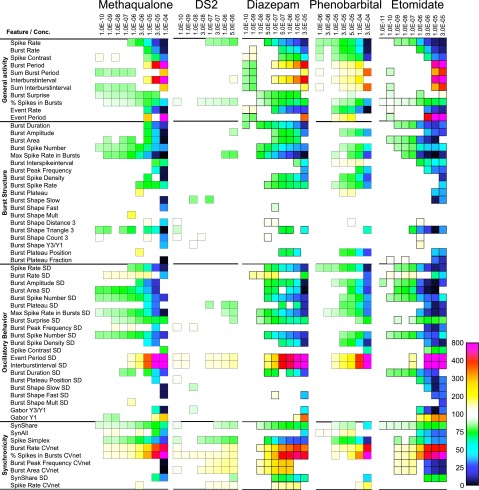
Fig. 8.
Summary of the changes induced by methaqualone, DS2, diazepam, phenobarbital, and etomidate on cortical network activity in vitro. The heat maps present the significant changes in 60 activity-describing parameters from four defined categories arising from eight or nine cumulatively increasing concentrations of the five modulators (concentrations are given in molar). The colors encode statistically significant modulator-induced changes (increases or decreases) in parameters relative to native activity (no drug, 100%).

