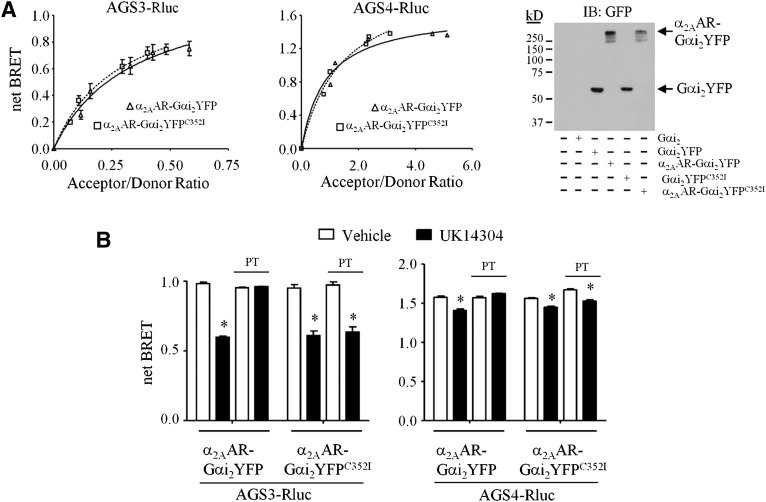
Fig. 2.
Agonist-induced regulation of an α2AAR-Gαi2 fusion protein complexed with the GPR proteins AGS3 and AGS4. (A, left panel) HEK293 cells expressing a fixed amount of AGS3Rluc (left) or AGS4Rluc (right) and increasing amounts of α2AAR-Gαi2YFP (squares) or α2AAR-Gαi2YFPC352I (triangles) were processed for BRET measurements as described in Materials and Methods. (Right panel) Lysates (50 μg) from control HEK293 cells or HEK293 cells expressing Gαi2, Gαi2YFP, α2AAR-Gαi2YFP, or α2AAR-Gαi2YFPC352I (750 ng of each plasmid) were subjected to SDS-PAGE, transferred to a polyvinylidene difluoride membrane, and immunoblotted (IB) with GFP antiserum. (B) HEK293 cells expressing AGS3Rluc (left panel) or AGS4Rluc (right panel) and α2AAR-Gαi2YFP or α2AAR-Gαi2YFPC352I were incubated in the absence or presence of PT (100 ng/ml) for 18 hours, as described in Materials and Methods. Cells were then washed and incubated with vehicle (Tyrode’s solution) or α2AAR agonist UK14304 (10 μM) for 5 minutes followed by fluorescence and luminescence readings to obtain net BRET signals, as described in Materials and Methods. (B, left panel) AGS3Rluc relative luminescence units: AGS3Rluc + α2AAR-Gαi2YFP: 335,234 ± 9929; AGS3Rluc + α2AAR-Gαi2YFP + PT: 327,626 ± 15,110; AGS3Rluc + α2AAR-Gαi2YFPC352I : 385,996 ± 22,073; AGS3Rluc + α2AAR-Gαi2YFPC352I + PT: 373,388 ± 17,790. Relative fluorescence units: α2AAR-Gαi2YFP: 111,523 ± 3246; α2AAR-Gαi2YFP + PT: 112,991 ± 2545; α2AAR-Gαi2YFPC352I: 110,420 ± 2416; α2AAR-Gαi2YFPC352I + PT: 112,565 ± 3072. (B, right panel) AGS4Rluc relative luminescence units: AGS4Rluc + α2AAR-Gαi2YFP: 87,143 ± 6516; AGS4Rluc + α2AAR-Gαi2YFP + PT: 71,193 ± 5723; AGS4Rluc + α2AAR-Gαi2YFPC352I: 148,939 ± 7362; AGS4Rluc + α2AAR-Gαi2YFPC352I + PT: 133,482 ± 11,038. Relative fluorescence units: α2AAR-Gαi2YFP: 106,882 ± 5325; α2AAR-Gαi2YFP + PT: 109,976 ± 5497; α2AAR-Gαi2YFPC352I: 142,380 ± 2980; α2AAR-Gαi2YFPC352I + PT: 166,057 ± 8005. All BRET data are expressed as mean ± S.E. from at least three independent experiments with triplicate determinations. Immunoblots are representative of three independent experiments. *P < 0.05 compared with vehicle-treated control group.

