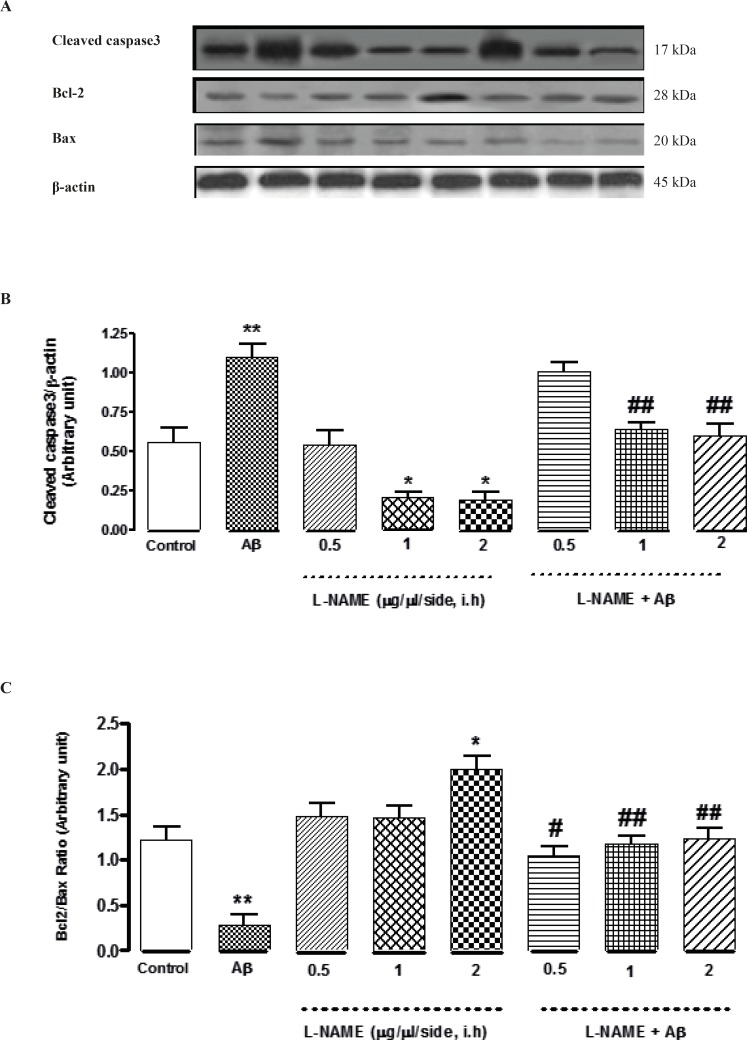
Figure 4.
Western blot analysis to measure the effect of L-NAME treatment on the expression of Caspase-3, Bcl-2 and Bax in the hippocampus of rats. (A) 60 μg proteins were alienated on SDS-PAGE, western blotted, probed with specific primary antibodies, and reprobed with control loading antibody (One typical western blot of each antibody is shown: n = 6). (B) The densities of cleaved caspase-3 bands were evaluated and their ratios to β-actin were measured. (C) The densities of Bcl-2 and Bax bands were measured and the ratio of Bcl-2 to Bax was evaluated. Each point shows the mean ± SEM. (*P < 0.05; **P < 0.01 different from the control group, #P < 0.05; ##P < 0.01 different from the Aβ-injected group

