Figure 4.
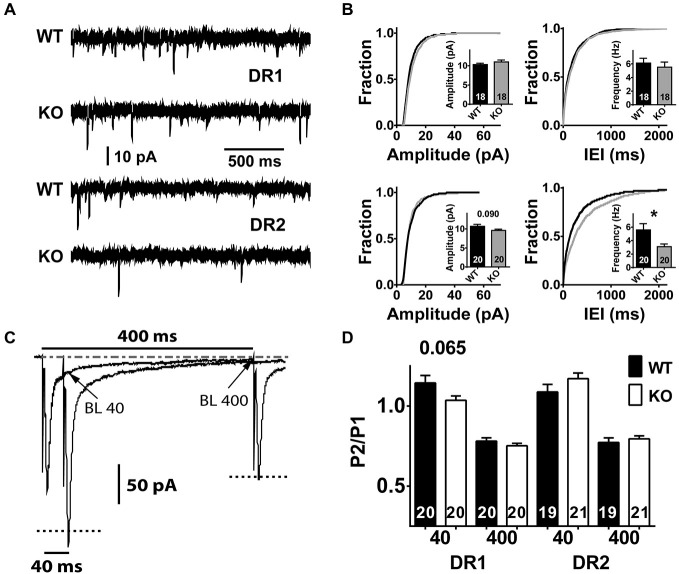
Characteristics of spontaneous miniature neurotransmission and short-term plasticity in the direct and indirect pathway MSNs of NL1 KO mice. (A) In the presence of picrotoxin (75–100 μM) and of Tetrodotoxin (0.75–1 μM), spontaneous miniature neurotransmission was recorded. After the membrane patch was broken by suction, the pipette intracellular solution was dialyzed for 8–10 min and recordings were taken for 2–5 min in order to observe at least 200 events per recorded neuron. The upper 2 traces and the lower 2 traces correspond to a 2 s segment recorded in the direct pathway or in the indirect pathway, respectively. The size and number of events look similar between genotypes in DR1 neurons, however, DR2 neurons show fewer events in NL1 KO mice. (B) DR2 neurons of NL1 KO mice show increased IEI (bottom right panel) reflected as an approximately 2-fold reduction in the frequency of mini events (inset). Cumulative distributions for amplitudes and for inter-event intervals (IEIs) were built with exactly 200 events per experiment to avoid distribution bias by experiments with higher number of events. (C) paired pulse ratio (PPR) average traces at IEIs of 40 ms or 400 ms. Downward deflections for stimulation # 1 for both IEIs are superimposed, therefore, only one event is apparent. The current relaxation after the peak for stimulus # 1 (P1) at 400 ms was used to determine the baseline level (BL) for stimulation # 2 (P2) at both IEI 40 ms and IEI 400 ms (P2–40 and P2–400, respectively). Peak amplitude of P2–40 was calculated by subtracting the amplitude of the BL at the time of the peak of P2 (BL 40) from its absolute amplitude. BL400 was taken as the average current amplitude of a 2 ms window just before P2- 400 was triggered. Similarly, peak amplitude for P2–400 was calculated by subtracting BL400 from the absolute peak value for the corresponding event. The dashed-dotted line at the top corresponds to the steady-state baseline. Dotted lines in both P2s correspond to their recalculated amplitudes after baseline subtraction. (D) No significant changes in PPR were identified between genotypes in either pathway, though a trend is apparent in DR1 neurons at IEI of 40 ms. *P < 0.05.

