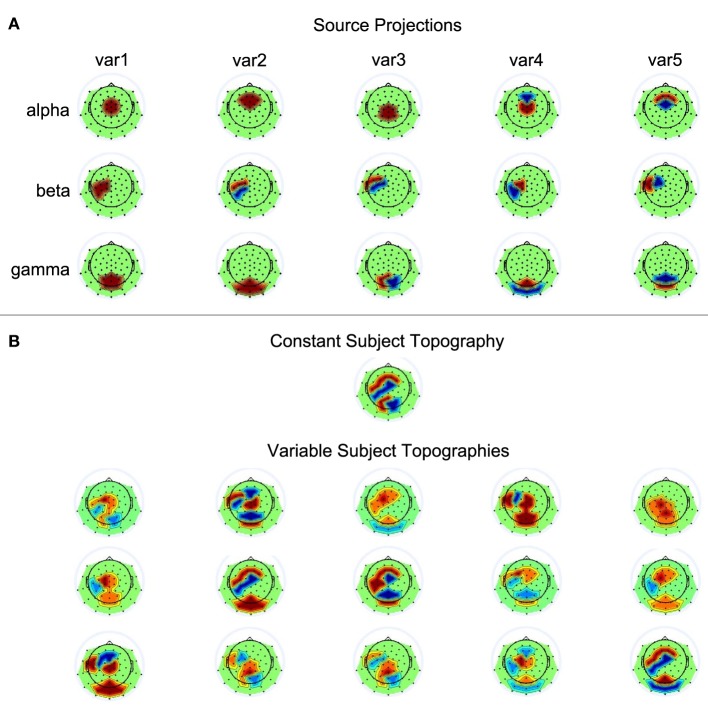
Figure 3.
Source projections. (A) The first, second, and third row each contain the five scalp projections used for the alpha, beta, and gamma source, respectively. Black dots on the scalp indicate electrode positions. Red and blue represent positive and negative weights, respectively. (B) Shown are the simulated subject topogrpahies that could either be constant or variable across subjects.

