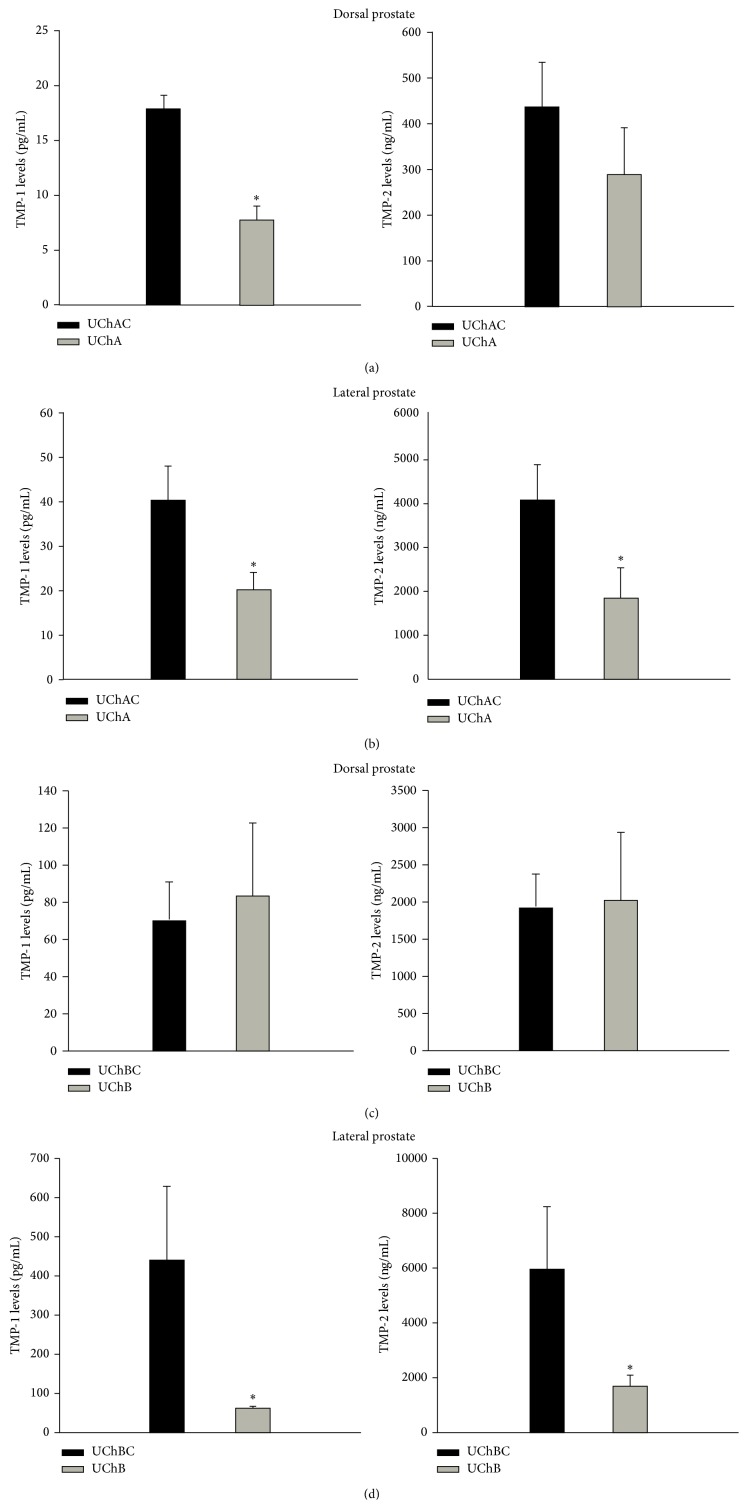
Figure 2.
TIMP-1 and TIMP-2 protein levels in the dorsal prostate (DP) and lateral prostate (LP) from low (UChA) and high (UChB) ethanol-preferring rats. UChAC and UChBC are respective controls. The TIMP-1 expression decreased significantly in the dorsal and lateral prostate of UChA rats (Figures 2(a) and 2(b)), and in the lateral prostate of UChB rats (Figure 2(d)). Conversely, TIMP-2 expression was significantly decreased in the lateral prostate of both UChA and UChB rats (Figures 2(a)–2(d)) and slightly reduced in the dorsal prostate of UChA rats. The histograms represent the values of densitometric analysis of the bands. Data are expressed as the mean ± SD. (a) TIMP-1 (P < 0.01). (b) and (d) TIMP-1 and TIMP-2 (P < 0.05).

