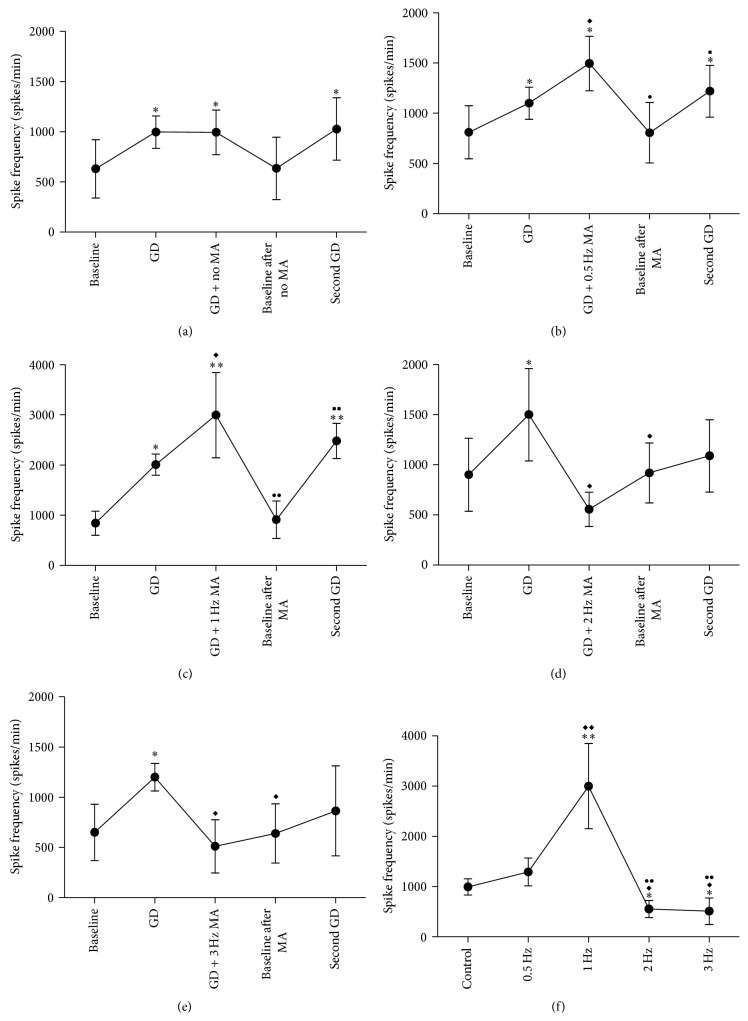
Figure 6.
Spike frequency responses of excitatory gastric-related WDR neurons in SDH to GD and different MA stimulations. (a) Control group, without MA stimulation. (b) 0.5, (c) 1, (d) 2, and (e) 3 Hz MA stimulation, respectively. (f) Spike frequency changes evoked by different MA stimulations. In (a), (b), (c), (d), and (e), compared with baseline, ∗ P < 0.05 and ∗∗ P < 0.01; compared with GD, ◆ P < 0.05 and ◆◆ P < 0.01; compared with GD + MA, ● P < 0.05 and ●● P < 0.01; compared with baseline after MA, ■ P < 0.05 and ■■ P < 0.01. In (f), compared with control, ∗ P < 0.05 and ∗∗ P < 0.01; compared with 0.5 Hz, ◆ P < 0.05 and ◆◆ P < 0.01; compared with 1 Hz, ●● P < 0.01.

