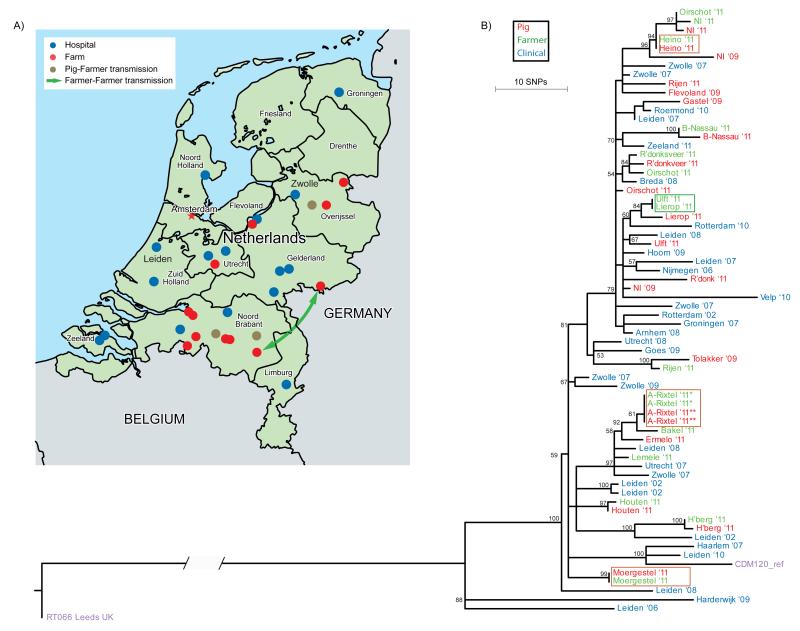
Figure 1. Transmission events and phylogeny of Clostridium difficile 078, the Netherlands 2002–11 (n=65).
A. Distribution of Dutch hospitals and pig farms included in this study. Only pig farms with a known location were plotted. Blue dots represent the hospitals (n = 16) where isolates from hospitalised patients were obtained, red dots represent pig farms (n = 12) where isolates from farmers and pigs were obtained. Brown dots represent the pig farms where pigs and farmers had identical C. difficile isolates. The green arrow indicates a potential (long-range) transmission event between two farms.
B. Phylogenetic tree revealing likely transmission between pigs and humans. Shown is the reconstructed phylogenetic tree based on 774 core genome single-nucleotide polymorphisms (SNPs). Samples are colour-coded according to their source: pig (red), farmer (green) and clinical isolate (blue). Identical genotypes with an epidemiological link (i.e. same location/farm) are marked with brown boxes. Long-range transmission events (i.e. different locations) are marked with a green box. The tip labels are coded with the city name followed by two numbers that represent year of isolation (’08 ⩠ 2008). The CDM120 genome (purple) is used for the reference-based mapping, RT066 (purple) is used as an out-group to root the tree. The scale indicates the branch length that correspond to 10 SNP differences. The numbers for the internal nodes show the support from 100 non-parametric bootstraps of a maximum likelihood reconstruction (only bootstrap values > 50 are shown).

