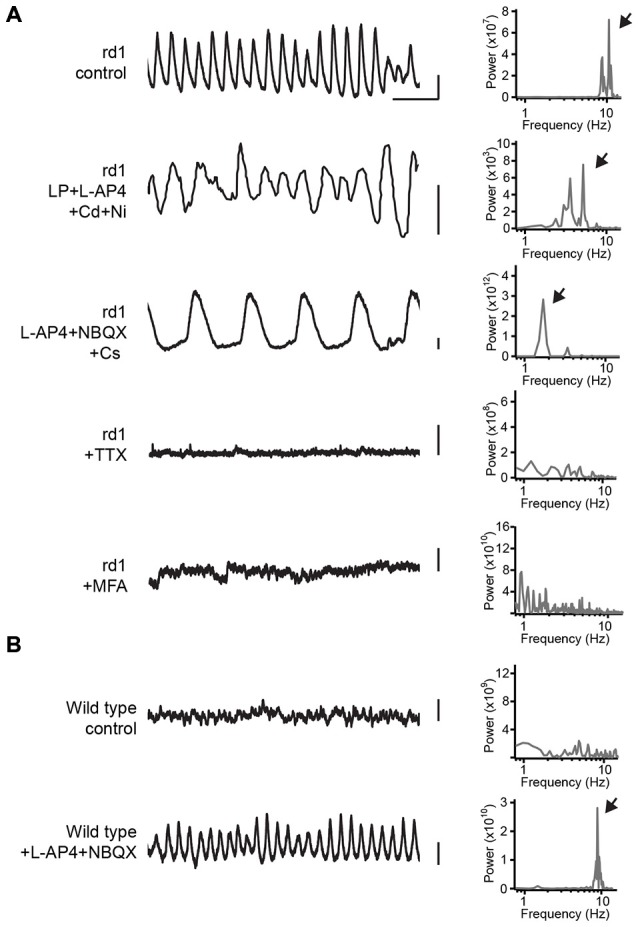
Figure 1.

Pharmacological analysis of spontaneous oscillations in AII amacrine cells. (A) On the left are shown plots of the membrane potential of AII amacrine cells in rd1 retina in control and in a set of different pharmacological agents. The top trace and bottom three traces were recorded in whole-mount retina. The second trace from the top is adapted from Figure 9C from Choi et al. (2014). A power spectral analysis is shown to the right of each voltage trace, and arrows point to the frequency of the oscillation. (B) The same as (A), except for wild type retina, see also data used in Trenholm et al. (2012). Abbreviations: LP, linopirdine dihydrochloride (M-type K+ channel blocker); L-AP4, L-(+)-2-amino-4-phosphonobutyric acid (mGluR6 receptor agonist); Cd, cadmium chloride (voltage-gated Ca2+ channel blocker); Ni, nickel chloride (voltage-gated Ca2+ channel blocker); NBQX, 2,3-dihydroxy-6-nitro-7-sulfamoyl-benzo[f]quinoxaline-2,3-dione (AMPA/Kainate receptor antagonist); Cs, cesium (Ih blocker); TTX, Tetrodotoxin (voltage-gated K+ channel blocker); MFA, meclofenamic acid (gap junction blocker). Scale bar is 500 ms for x-axis; 3 mV for y-axis.
