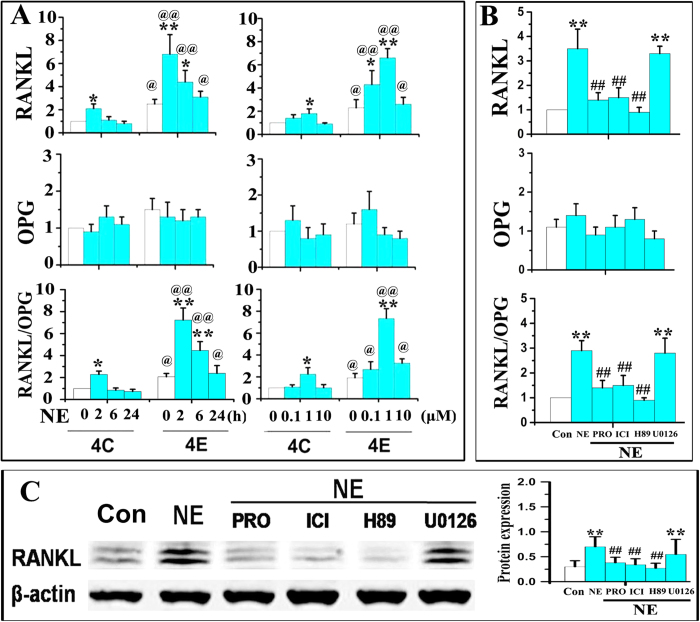
Figure 6. Expression of RANKL, OPG and RANKL/OPG ratio by MSCs after norepinephrine (NE) treatment.
A and B: Real-time PCR of the expression RANKL, OPG and RANKL/OPG ratio by MSCs after NE stimulation. The MSCs were isolated from condylar subchondral bone of 4-week control (4C) and 4-week experimental (4C) rats, and were treated by NE for 2, 6 and 24 h at 0.1, 1 and 10 μM, respectively (A). In addition, MSCs from 4-week experimental rats were stimulated by 1 μM NE for 2 h alone, or pre-treated for 1 h with 10 μM propranolol (PRO), 1 μM ICI 118,551 (ICI), 5 μM H-89 or 5 μM U-0126 (U0126) (B). *P < 0.05: vs vehicle-treated MSCs, **P < 0.01: vs vehicle-treated MSCs; @P < 0.05: vs the corresponding NE-treated MSCs from 4-week control (4C), @@P < 0.01: vs the corresponding NE-treated MSCs from 4-week control (4C), ##P < 0.01: vs NE-treated MSCs. C: Western blot of the RANKL expression by MSCs stimulated by 1 μM NE for 2 h alone, or pre-treated for 1 h with 10 μM PRO, 1 μM ICI, 5 μM H-89 or 5 μM U0126. The MSCs were isolated from4-week experimental rats.

