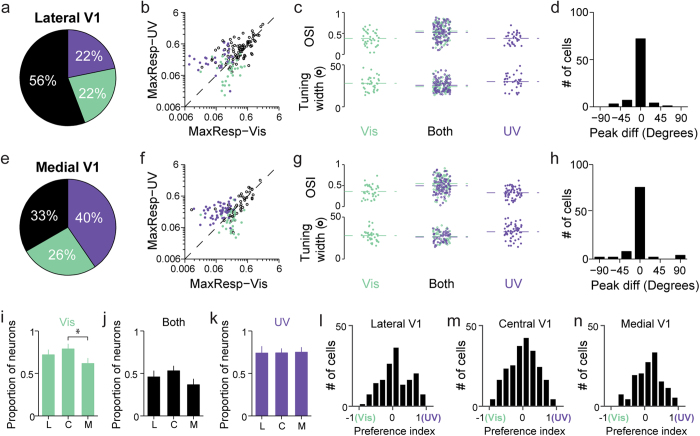
Figure 3. Neurons orientation-tuned to UV stimuli were distributed across areas of mouse V1 representing dorsal and ventral visual field.
(a–d) Lateral V1 (dorsal visual field). (a) Pie chart showing the percentage of neurons classified as orientation selective to only visible stimulation (green), only UV stimulation (purple), or both (black) (156 neurons in 3 animals). (b) Scatter plot of the maximal response to UV versus that to visible gratings for neurons orientation-selective to only visible (green dot), only UV (purple dot), and both visible-and-UV (open black circle) gratings. (c) Scatter plots of orientation selectivity index and tuning width. Dashed lines indicate mean values. (d) Histogram of difference in the preferred orientations of neurons orientation-selective to both UV and visible gratings. (e–h) Medial V1 (ventral visual field) (141 neurons in 4 animals). (i–k) Proportions of neurons selective for visible, both and UV wavelength ranges among all orientation-selective neurons recorded in lateral (L), central (C) and medial (M) V1 (Mann-Whitney test, *P = 0.02). (l–n) Distributions of the response preference index for neurons located in lateral, central and medial V1, respectively.

