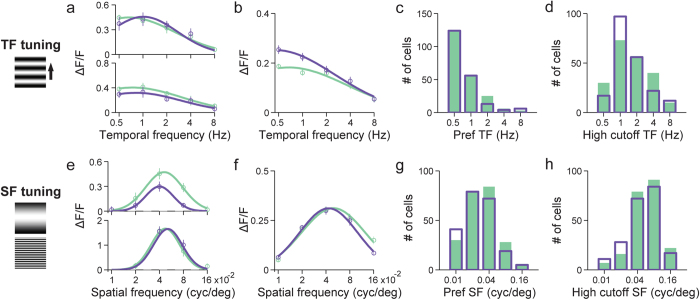
Figure 4. Temporal and spatial frequency tuning properties are similar for UV and visible stimuli.
(a) Temporal frequency (TF) tuning curves for UV and visible upward drifting gratings for two example neurons. They were generated by averaging ∆F/F over the five second window following each stimulus onset. Open circles, mean; vertical lines, error bar, SEM; curves, log-Gaussian fits to mean data. Green: visible; purple: UV. (b) Average TF tuning curves over 211 and 218 neurons (N = 7 animals) that responded to UV and visible stimuli, respectively. (c) Distributions of preferred TF to UV (purple open bar) and visible stimuli (green solid bar). (d) Distributions of high cutoff TF to UV and visible stimuli. (e) Spatial frequency (SF) tuning curves for UV and visible upward drifting gratings are shown for two example neurons, generated by averaging ∆F/F over the five second window following each stimulus onset. (f) Average SF tuning curves over 247 and 226 neurons (N = 4 animals) that responded to UV and visible stimuli, respectively. (g) Distributions of preferred SF to UV and visible stimuli. (h) Distributions of high cutoff SF to UV and visible stimuli.

