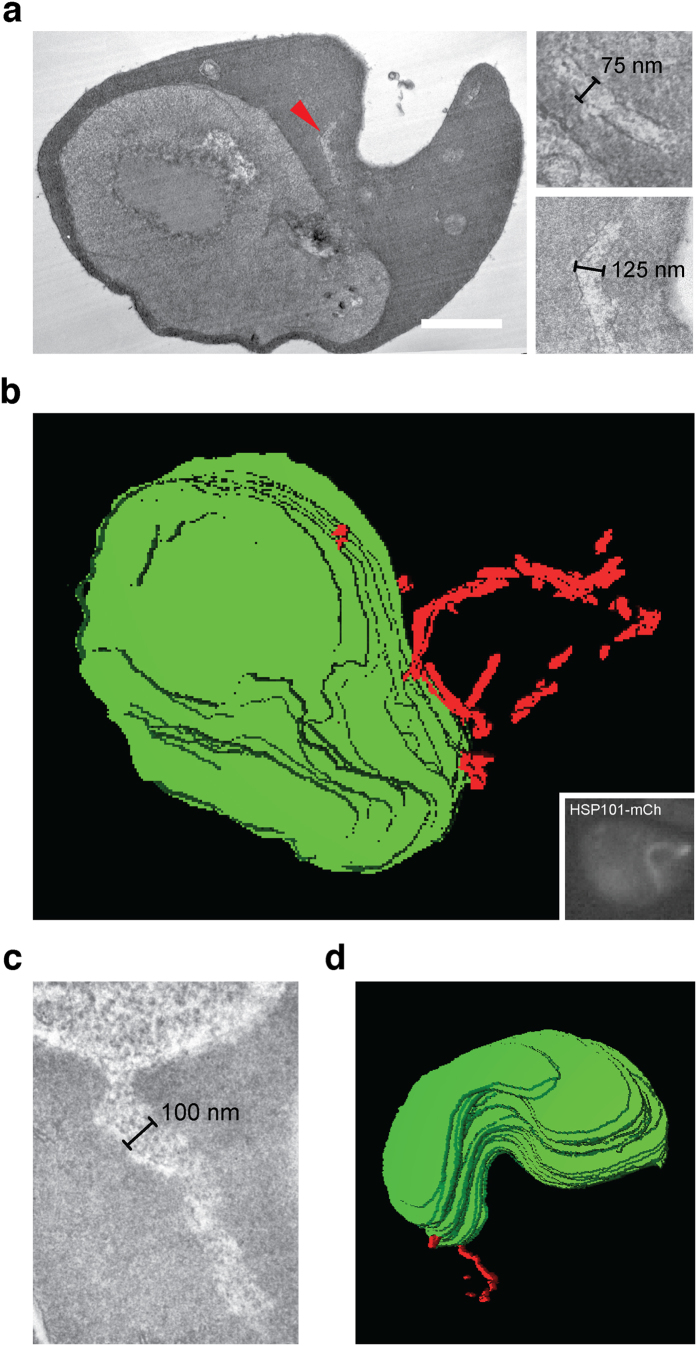
Figure 4. Ultrastructure of the vacuolar tubules.
(a) Representative transmission electron micrograph (TEM) of an hsp101-mCherry-infected erythrocyte, obtained by correlative light and electron microscopy (left). The red arrowhead denotes a tubular extension. Two representative high magnification images of the compartment are shown (right). Scale bar, 1 μm. (b) Tubules were visualized by fluorescence microscopy (inset) and correlated with multiple transmission electron microscopic (TEM) sections of the same cell. The 3D-reconstruction was generated by parasite membrane alignment of 29 consecutive TEM sections. Green, parasite surface; red, tubule. (c) TEM section of a WT-infected erythrocyte. Shown is a representative high magnification image of a vacuolar tubule. (d) 3D-reconstruction generated by parasite membrane alignment of 19 TEM sections of a WT-infected erythrocyte. Green, parasite surface; red, tubule.

