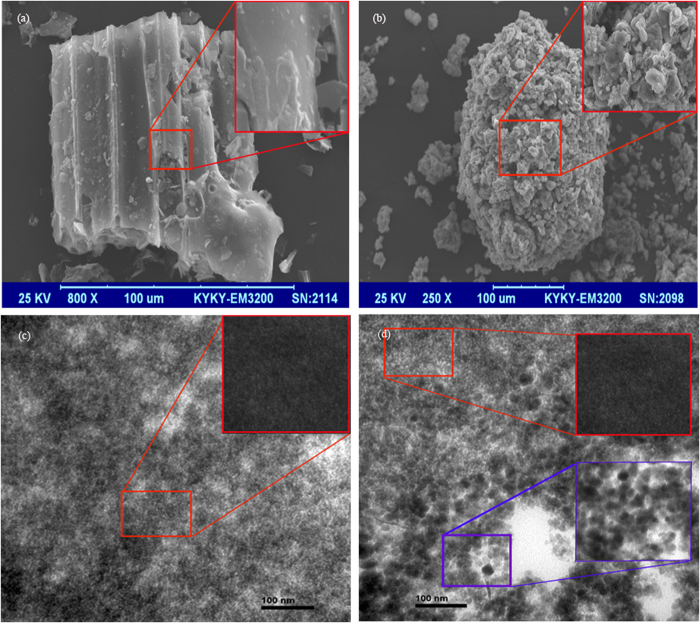
Figure 2. Scanning electron microscope (SEM) and transmission electron microscope (TEM) images of two different biochars.
(a) SEM image of acid-treated biochar (control), (b) SEM image of Fe3O4 coated biochar, (c) TEM image of acid-treated biochar, (d) TEM image of Fe3O4 coated biochar. Phases of ATB and MBC highlighted in small boxes are magnified 1000 times in big boxes.

