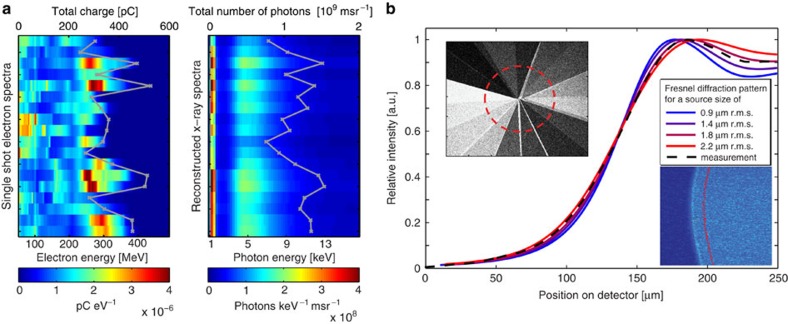
Figure 2. Characterization of the betatron source.
(a) Electron and corresponding X-ray spectra as seen by the sample for 18 individual laser shots. The X-ray spectra were reconstructed from the transmission signal of the filter cake with overall thicknesses ranging from 20 to 630 μm (see left inset in b). Inside the red circle, corresponding to (1.35 × 10⁻²) msr, (1.6±0.3) × 107 photons are detected and analysed for their energy. Even for large electron energy fluctuations, the X-ray spectral shape is remarkably stable. (b) Source size measurement: A comparison of the measured intensity distribution integrated along a 100-μm thick tungsten wire (right inset) and the modelled intensity distribution for a Gaussian source spot, taking into account the spectra in a, reveal a best value of 1.8 μm r.m.s.

