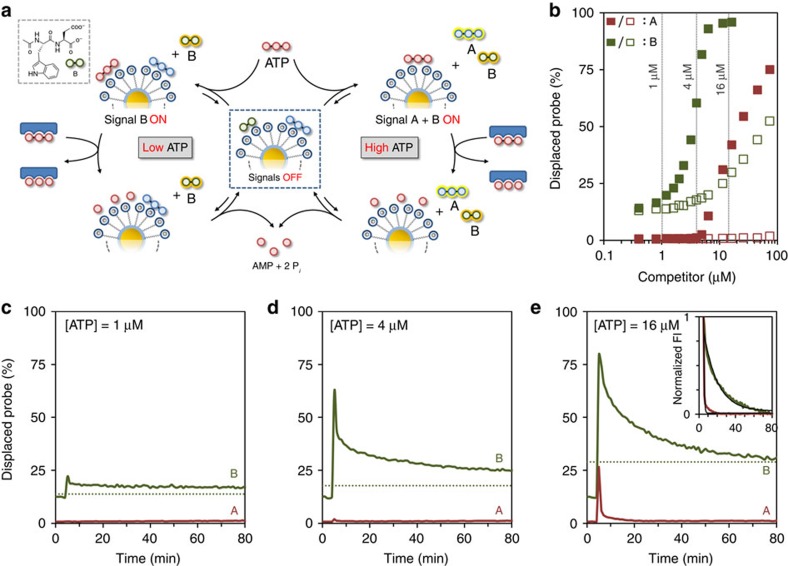
Figure 5. ATP-dependent activation of two different signals.
(a) Schematic representation of the ATP-dependent transient generation of one or two signals. (b) Amount of displaced probe A (red) or B (green) as a function of the concentration of either ATP (filled squares) or the waste mixture AMP+2Pi (empty squares). (c–e) Amount of displaced probe A (red) and B (green) as a function of time on the addition of ATP at 1 (c), 4 (d) or 16 μM (e) concentrations. The dotted lines mark the expected end value expected for probe B in the presence of the respective amount of waste formed. The inset in e gives the normalized change in FI as a function of time for the two probes and demonstrates the much faster decay of the signal originating from the high affinity prove A. In all these experiments probe A was excited at 370 nm (rather than at 450 nm) to obtain similar fluorescence intensities for probes A and B, thus permitting a monitoring of both probes with the same slit widths. Experimental conditions: [TACN·Zn2+]=20±1 μM, [A]=[B]=0.5 μM, [HEPES]=10 mM, pH 7.0, [CaCl2]=1.0 mM, [potato apyrase]=0.3 U ml−1, 37 °C. λex, A=370 nm, λem, A=493 nm, λex, B=280 nm, λem, B=360 nm, slits=10/10 nm.

