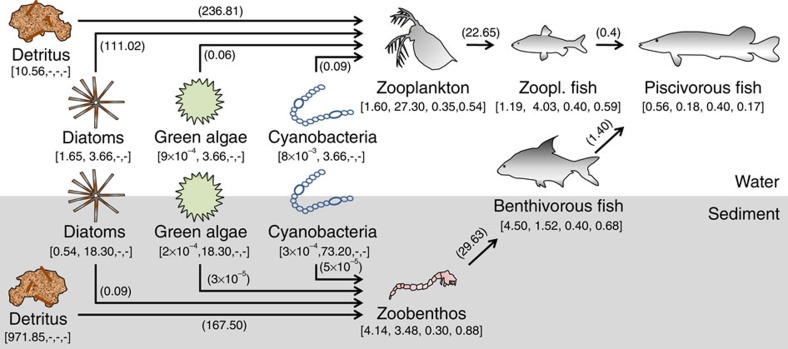
Figure 1. Schematic representation of the aquatic food web and the feeding relations.
The food web comprises a pelagic and benthic food chain linked by a shared predator. Data (square brackets) used to calculate feeding rates (parentheses) are given in the sequence biomass (g m−2), specific death rate (per year), assimilation efficiency and production efficiency. Feeding rates (g m−2 per year) are given near their respective arrows. Settling, resuspension and reproduction fluxes and flows to the detritus pools are not represented here but were included in the analyses. The data belong to a clear-water state receiving 2.6 mg P m−2 d−1.

