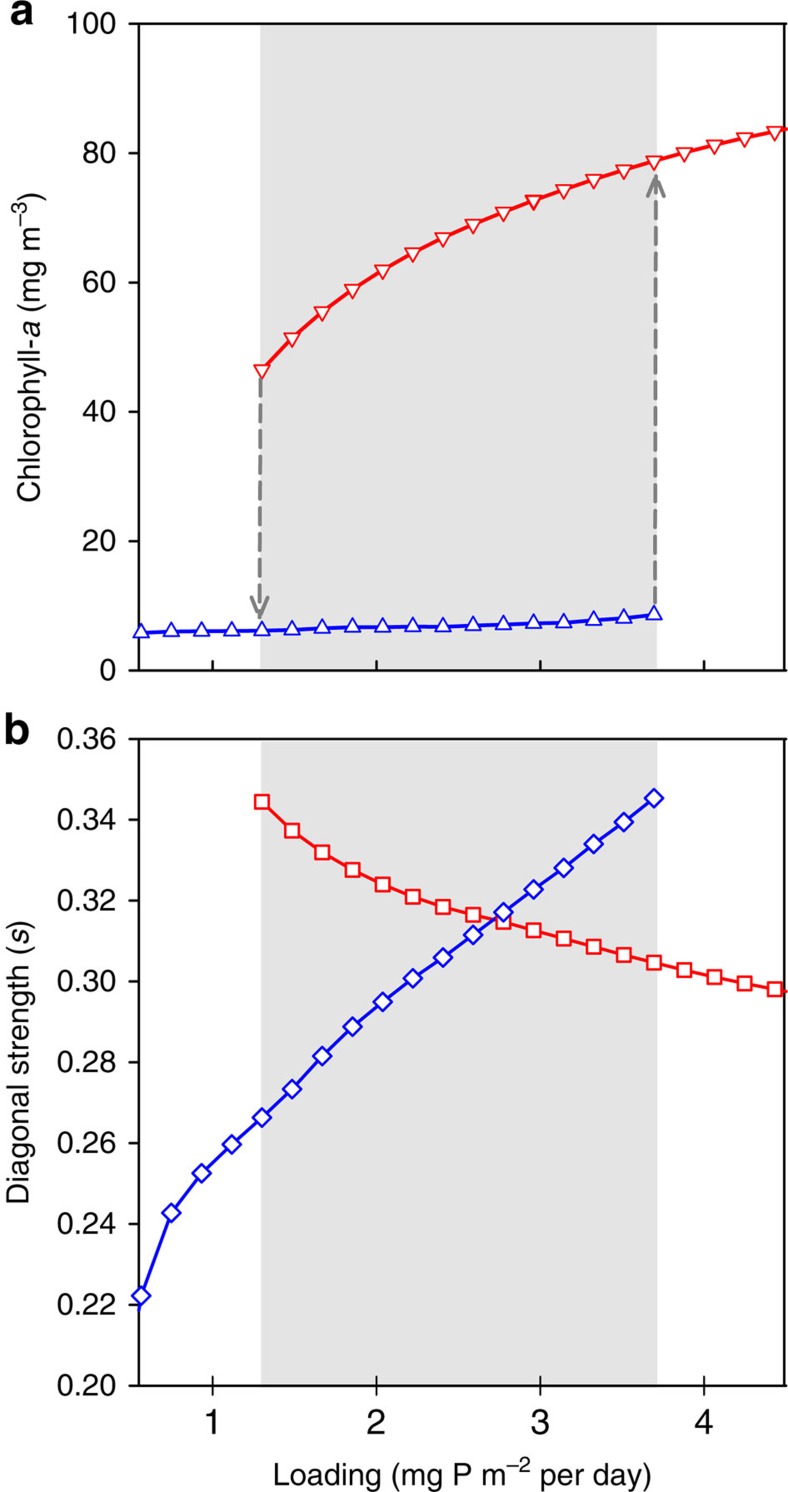
Figure 2. Ecosystem and food-web response to nutrient loading.
(a) The equilibrium concentration (yearly average) chlorophyll-a in the water column, as proxy for the ecosystem state, for two initial states: a clear- (blue upward triangles) and a turbid-water state (red downward triangles). (b) Food-web stability, represented by the intraspecific interaction needed for matrix stability (s) for food webs in a clear- (blue diamonds) and a turbid-water state (red squares). Stability decreases with increasing s.

