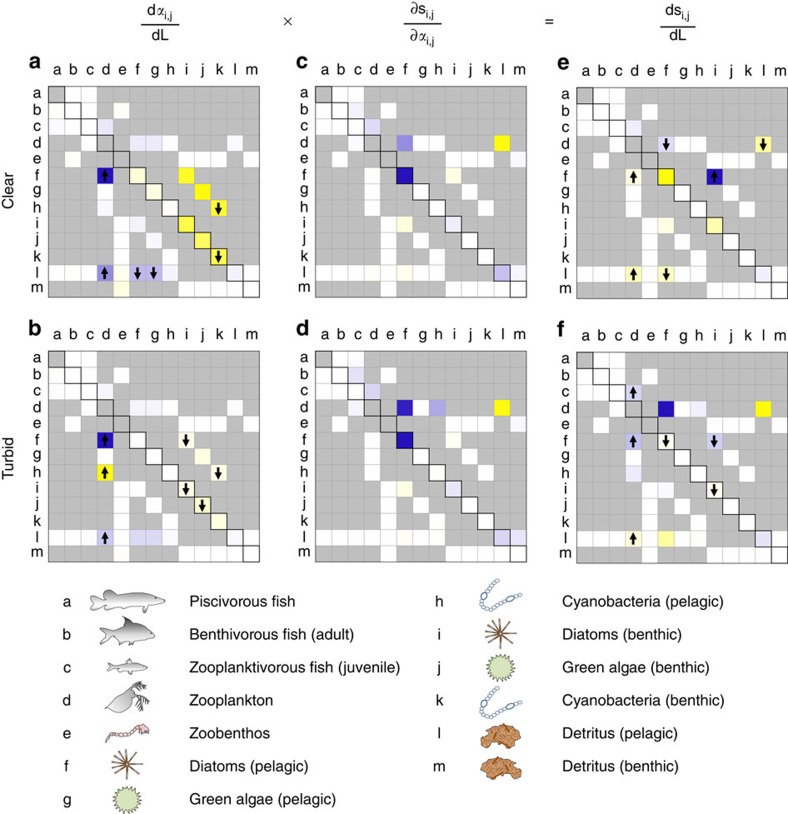
Figure 3. Graphical summarization of the changing trophic interactions and their impact on food-web stability.
The left panels show which interaction terms are impacted by changing nutrient loading. Cell colour indicates whether interaction strength increases (blue), decreases (yellow) or does not change (white) during eutrophication (a) and re-oligotrophication (b). Colour intensity depicts the relative magnitude of change. Arrows indicate whether the change is notably progressive (upward) or descending (downward) towards the regime shift. The middle panels (c,d) show the sensitivity of food-web stability to changes in interaction strengths. An increase of interaction strength can have a positive effect (blue cells), negative effect (yellow cells) or no effect (white cells) on stability (and hence an inverse effect on s). The intensity of the colour indicates the relative magnitude of the effect. The right panels show the contribution of each interaction term to the impact of eutrophication (e) and re-oligotrophication (f) on food-web stability, which is the product of the foregoing. Colours indicate whether interactions have a positive (blue), negative (yellow) or no effect (white) on stability (and inversely on s).

