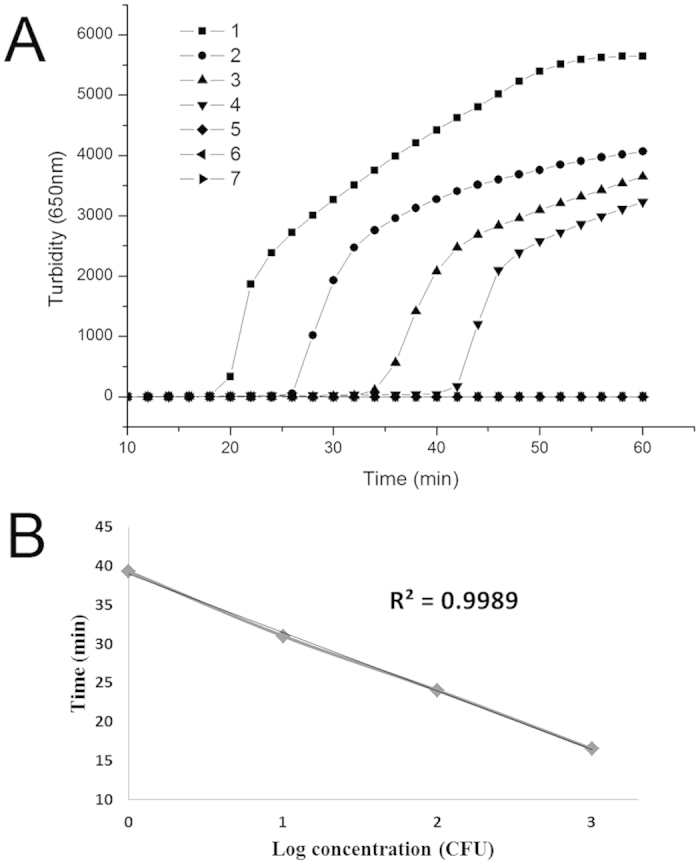
Figure 2. Sensitivity of serially diluted DNA quantitation by PSR amplification.

(A): Isothermal amplification plot represents amplification products as observed through a real-time turbidimeter instrument every 6s at different concentrations of DNA. Data represents the mean of three replicates for each standard dilution. Amplification was performed at 65 °C for 60 min. (B): The standard curve obtained by plotting the value of crossing threshold (Ct) versus the concentration of CFU equivalents. 1, 6000 CFU; 2, 600 CFU; 3, 60 CFU; 4, 6 CFU; 5, 0.6 CFU; 6, 0.06 CFU; 7, negative control (double-distilled water).
